
Concept explainers
Videos
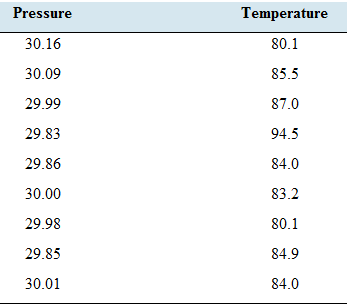
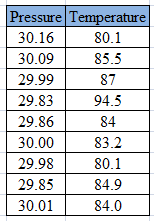
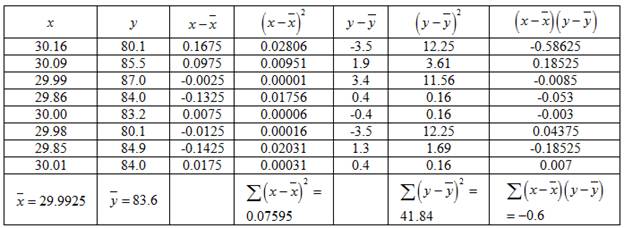
Hot enough for you? The following table presents the temperature, in degrees Fahrenheit, and barometric pressure, in inches of mercury, on August 15 at 12 noon in Macon. Georgia; over a nine-year period.
- Compute the least-squares regression line for predicting temperature from barometric pressure.
- Compute file coefficient of determination.
- Construct a
scatterplot of due temperature (y) versus the barometric pressure (x). - Which point is an outlier?
- Remove outlier and compute least-squares regression line for predicting temperature from barometric pressure.
- Is the outlier Explain.
- Compute the coefficient of determination for the data set with the outlier removed. Is the proportion of variation explained by the least-squares regression fine greater, less, or about the same without die outlier? Explain.
a.
The least squares regression line for the given data set.
Answer to Problem 23E
Explanation of Solution
Given information:
Belowtable represents the temperature, in degrees Fahrenheit, and barometric pressure, in inches of mercury, on August

Formula used:
The equation for least-square regression line:
Where
The correlation coefficient of a data is given by:
Where,
The standard deviations are given by:
Calculation:
The mean of x is given by:
The mean of y is given by:
The data can be represented in tabular form as:
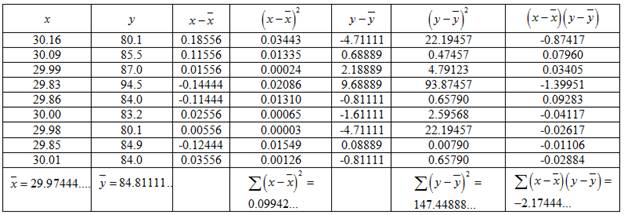
Hence, the standard deviation is given by:
And,
Consider,
Putting the values in the formula,
Putting the values to obtain
Putting the values to obtain
Hence, the least-square regression line is given by:
Therefore, the least squares regression line for the given data set is
b.
The coefficient of determination.
Answer to Problem 23E
Explanation of Solution
Given information:
Same as part
Calculation:
From part
The coefficient of determination is given by:
Where
Putting the values to obtain Coefficient of Determination,
Therefore, the Coefficient of Determination is
c.
Construct the scatterplot of the temperature
Explanation of Solution
Given information:
Below table represents the temperature, in degrees Fahrenheit, and barometric pressure, in inches of mercury, on August

Calculation:
The scatter plot can be drawn with the help of the given data. The Pressure will be taken on horizontal axis and the temperature will betaken on vertical axis.
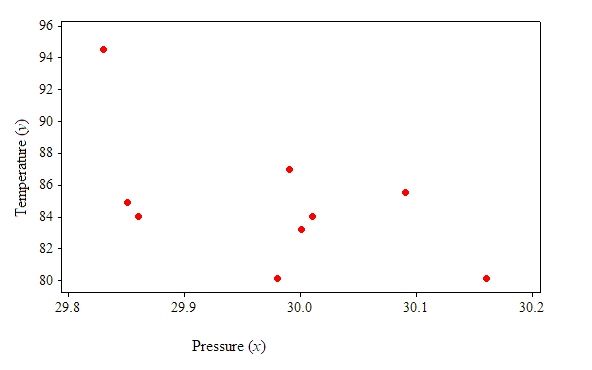
From the scatterplot, it is observed that there is a moderate association between the “variable temperature” and “barometric pressure”.
d.
The points which are outliers.
Answer to Problem 23E
Explanation of Solution
Given information:
Same as part
Calculation:
From above table, it can be seen that among all the
Therefore, the outlier point is
e.
The least squares regression line for the given data set excluding the outlier.
Answer to Problem 23E
Explanation of Solution
Given information:
Same as part
Formula used:
The equation for least-square regression line:
Where
The correlation coefficient of a data is given by:
Where,
The standard deviations are given by:
Calculation:
From part
Excluding the outlier,
The mean of
The mean of
The data can be represented in tabular form as:
Hence, the standard deviation is given by:
And,
Consider,
Putting the values in the formula,
Putting the values to obtain
Plugging the values to obtain
Hence, the least-square regression line is given by:
Therefore, the least squares regression line for the given data set by excluding the outlier is
f.
Whether the outlier is influential.
Answer to Problem 23E
The outlier is influential.
Explanation of Solution
Given information:
Same as part
Calculation:
From part
From part
From above equations, it can be observed that removing the outlier creates a great difference in the equation of the least square regression line.
Therefore, the outlier is influential.
g.
The coefficient of determination for the data set excluding the outliers.
Answer to Problem 23E
The proportion of variation is less without the outlier.
Explanation of Solution
Given information:
Same as part
Calculation:
The coefficient of determination is given by:
Where
From part
Putting the values to obtain Coefficient of Determination,
Therefore, the Coefficient of Determination is
Here the coefficient of determination reduced without the outlier.
Hence, the proportion of variance explained is less without the outlier.
Want to see more full solutions like this?
Chapter 4 Solutions
ELEMENTARY STATISTICS(LL)(FD)


- Apply STATA commands & submit the output for each question only when indicated below i. Apply the command egen to create a variable called "wyd" which is the rowtotal function on variables bwght & faminc. ii. Apply the list command for the first 10 observations to show that the code in part i worked. Include the outcome of this code iii. Apply the egen command to create a new variable called "bwghtsum" using the sum function on variable bwght by the variable high_faminc (Note: need to apply the bysort' statement) iv. Apply the "by high_faminc" statement to find the V. descriptive statistics of bwght and bwghtsum Include the output of this code. Why is there a difference between the standard deviations of bwght and bwghtsum from part iv of this question?arrow_forwardAccording to a health information website, the distribution of adults’ diastolic blood pressure (in millimeters of mercury, mmHg) can be modeled by a normal distribution with mean 70 mmHg and standard deviation 20 mmHg. b. Above what diastolic pressure would classify someone in the highest 1% of blood pressures? Show all calculations used.arrow_forwardWrite STATA codes which will generate the outcomes in the questions & submit the output for each question only when indicated below i. ii. iii. iv. V. Write a code which will allow STATA to go to your favorite folder to access your files. Load the birthweight1.dta dataset from your favorite folder and save it under a different filename to protect data integrity. Call the new dataset babywt.dta (make sure to use the replace option). Verify that it contains 2,998 observations and 8 variables. Include the output of this code. Are there missing observations for variable(s) for the variables called bwght, faminc, cigs? How would you know? (You may use more than one code to show your answer(s)) Include the output of your code (s). Write the definitions of these variables: bwght, faminc, male, white, motheduc,cigs; which of these variables are categorical? [Hint: use the labels of the variables & the browse command] Who is this dataset about? Who can use this dataset to answer what kind of…arrow_forward
- Apply STATA commands & submit the output for each question only when indicated below İ. ii. iii. iv. V. Apply the command summarize on variables bwght and faminc. What is the average birthweight of babies and family income of the respondents? Include the output of this code. Apply the tab command on the variable called male. How many of the babies and what share of babies are male? Include the output of this code. Find the summary statistics (i.e. use the sum command) of the variables bwght and faminc if the babies are white. Include the output of this code. Find the summary statistics (i.e. use the sum command) of the variables bwght and faminc if the babies are male but not white. Include the output of this code. Using your answers to previous subparts of this question: What is the difference between the average birthweight of a baby who is male and a baby who is male but not white? What can you say anything about the difference in family income of the babies that are male and male…arrow_forwardA public health researcher is studying the impacts of nudge marketing techniques on shoppers vegetablesarrow_forwardThe director of admissions at Kinzua University in Nova Scotia estimated the distribution of student admissions for the fall semester on the basis of past experience. Admissions Probability 1,100 0.5 1,400 0.4 1,300 0.1 Click here for the Excel Data File Required: What is the expected number of admissions for the fall semester? Compute the variance and the standard deviation of the number of admissions. Note: Round your standard deviation to 2 decimal places.arrow_forward
- A pollster randomly selected four of 10 available people. Required: How many different groups of 4 are possible? What is the probability that a person is a member of a group? Note: Round your answer to 3 decimal places.arrow_forwardWind Mountain is an archaeological study area located in southwestern New Mexico. Potsherds are broken pieces of prehistoric Native American clay vessels. One type of painted ceramic vessel is called Mimbres classic black-on-white. At three different sites the number of such sherds was counted in local dwelling excavations. Test given. Site I Site II Site III 63 19 60 43 34 21 23 49 51 48 11 15 16 46 26 20 31 Find .arrow_forwardRothamsted Experimental Station (England) has studied wheat production since 1852. Each year many small plots of equal size but different soil/fertilizer conditions are planted with wheat. At the end of the growing season, the yield (in pounds) of the wheat on the plot is measured. Suppose for a random sample of years, one plot gave the following annual wheat production (in pounds): 4.46 4.21 4.40 4.81 2.81 2.90 4.93 3.54 4.16 4.48 3.26 4.74 4.97 4.02 4.91 2.59 Use a calculator to verify that the sample variance for this plot is . Another random sample of years for a second plot gave the following annual wheat production (in pounds): 3.89 3.81 3.95 4.07 4.01 3.73 4.02 3.78 3.72 3.96 3.62 3.76 4.02 3.73 3.94 4.03 Use a calculator to verify that the sample variance for this plot is . Suppose that we test the claim using that the population variance of annual wheat production for the first plot is larger…arrow_forward
- It is thought that prehistoric Native Americans did not take their best tools, pottery, and household items when they visited higher elevations for their summer camps. It is hypothesized that archaeological sites tend to lose their cultural identity and specific cultural affiliation as the elevation of the site increases. Let x be the elevation (in thousands of feet) for an archaeological site in the southwestern United States. Let y be the percentage of unidentified artifacts (no specific cultural affiliation) at a given elevation. Suppose that the following data were obtained for a collection of archaeological sites in New Mexico: x 5.50 6.00 6.75 7.00 7.75 y 37 38 92 70 99 Find the equation of the least squares line . Round a and b to three decimal places.arrow_forwardA fitness trainer wants to estimate the effect of fitness activities on muscle mass for different weight categories of club members. They choose the most popular fitness classes at the gym: yoga, circuit training, and high-intensity interval training (HIIT). Suppose that the weights of club members are separated into three levels: under 155 pounds, 155 – 200 pounds, and over 200 pounds. Draw a flow chart showing the design of this experiment.arrow_forwardThe systolic blood pressure of individuals is thought to be related to both age and weight. Let the systolic blood pressure, age, and weight be represented by the variables x1, x2, and x3, respectively. Suppose that Minitab was used to generate the following descriptive statistics, correlations, and regression analysis for a random sample of 15 individuals. Descriptive Statistics Variable N Mean Median TrMean StDev SE Mean x 1 15 154.14 154.34 154.14 3.842 0.992000 x 2 15 59.69 60.19 59.69 1.462 0.377487 x 3 15 205.55 204.75 205.55 4.558 1.176871 Variable Minimum Maximum Q1 Q3 x 1 125 178 141.803 167.244 x 2 41 80 47.754 78.415 x 3 126 240 140.395 224.008 Correlations (Pearson) x 1 x 2 x 2 0.892 x 3 0.839 0.567 Regression Analysis The regression equation is x 1 = 0.883 + 1.257x2 + 0.871x3 Predictor Coef StDev T P Constant 0.883 0.635 1.39 0.095 x 2 1.257 0.635 1.98 0.036 x 3 0.871 0.419 2.08 0.030 S = 0.428 R-sq = 92.7 %…arrow_forward
 Glencoe Algebra 1, Student Edition, 9780079039897...AlgebraISBN:9780079039897Author:CarterPublisher:McGraw Hill
 Big Ideas Math A Bridge To Success Algebra 1: Stu...AlgebraISBN:9781680331141Author:HOUGHTON MIFFLIN HARCOURTPublisher:Houghton Mifflin Harcourt
 Functions and Change: A Modeling Approach to Coll...AlgebraISBN:9781337111348Author:Bruce Crauder, Benny Evans, Alan NoellPublisher:Cengage Learning
 Trigonometry (MindTap Course List)TrigonometryISBN:9781337278461Author:Ron LarsonPublisher:Cengage Learning
 Algebra & Trigonometry with Analytic GeometryAlgebraISBN:9781133382119Author:SwokowskiPublisher:Cengage