
Concept explainers
Videos
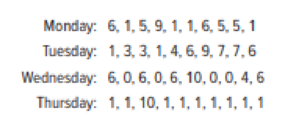
Spirit Airlines kept track of the number of empty seats on flight 308 (DEN-DTW) for 10 consecutive trips on each weekday except Friday. (a) Sort the data for each day. (b) Find the mean,
a.
Arrange the data.
Answer to Problem 16SE
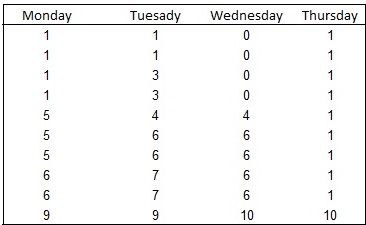
The sorted data is:
Explanation of Solution
Calculation:
The dataset represents the number of empty seats on flight 308 for 10 consecutive trips.
The data set of empty seats can be sorted either ascending or descending.
Here, the data is sorted in the ascending order.
Sorting:
Software procedure:
Step-by-step procedure to sort the data in ascending using the EXCEL is given below:
- Open an EXCEL file.
- Enter the data in the column in H cells H1 to H10, column in I cells I1 to I10, J cells J1 to J10 and column in K cells K1 to K10.
- Choose Data > Sort.
- In Column drop down box, select Column H.
- In Sort on drop down box, select Values.
- In Order drop down box, select “Smallest to Largest”.
- Click OK.
- In Column drop down box, select Column I.
- In Sort on drop down box, select Values.
- In Order drop down box, select “Smallest to Largest”.
- Click OK.
- In Column drop down box, select Column J.
- In Sort on drop down box, select Values.
- In Order drop down box, select “Smallest to Largest”.
- Click OK.
- In Column drop down box, select Column K.
- In Sort on drop down box, select Values.
- In Order drop down box, select “Smallest to Largest”.
- Click OK.
Thus, the sorted data has been stored in the column in H cells H1 to H10, column in I cells I1 to I10, J cells J1 to J10 and column in K cells K1 to K10.
b.
Find the Mean, Median, Mode, Midrange, Geometric mean, and 10% Trimmed mean.
Answer to Problem 16SE
The Mean, Median, Mode, Midrange, Geometric mean, and 10% Trimmed mean is:
| Descriptive measures | Monday | Tuesday | Wednesday | Thursday |
| Mean | 4 | 4.70 | 3.80 | 1.90 |
| Median | 5 | 5 | 5 | 1 |
| Mode | 1 | 1 | 6 | 1 |
| Geometric mean | 2.89 | 3.76 | Not applicable | 1.26 |
| Midrange | 5 | 5 | 5 | 5.50 |
| Trimmed mean | 3.75 | 4.63 | 3.50 | 1 |
Explanation of Solution
Calculation:
For Monday:
Mean:
Software procedure:
Step-by-step software procedure to obtain Mean using EXCEL software is as follows:
- Open an EXCEL file.
- Enter the data in the column I in cells I1 to I10.
- In cell A1, enter the formula “=AVERAGE(I1:I10)”.
- Output using EXCEL software is given below:
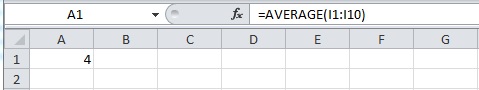
Thus, the mean number of empty seats on Monday is 4.
Median:
Software procedure:
Step-by-step software procedure to obtain Median using EXCEL software is as follows:
- Open an EXCEL file.
- Enter the data in the column I in cells I1 to I10.
- In cell A1, enter the formula “=MEDIAN(I1:110)”.
- Output using EXCEL software is given below:
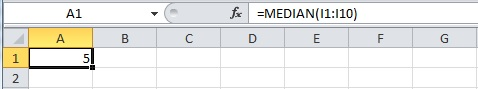
Thus, the median for the number of empty seats on Monday is 5.
Mode:
Software procedure:
Step-by-step software procedure to obtain Mode using EXCEL software is as follows:
- Open an EXCEL file.
- Enter the data in the column I in cells I1 to I10.
- In cell A1, enter the formula “=MODE.SNGL(I1:I10)”.
- Output using EXCEL software is given below:
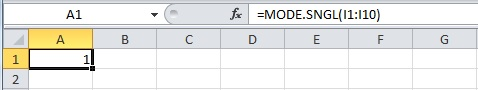
Thus, the mode for the number of empty seats on Monday is 1.
Geometric mean:
Software procedure:
Step-by-step software procedure to obtain Geometric mean using EXCEL software is as follows:
- Open an EXCEL file.
- Enter the data in the column I in cells I1 to I10.
- In cell A1, enter the formula “=GEOMEAN(I1:I10)”.
- Output using EXCEL software is given below:
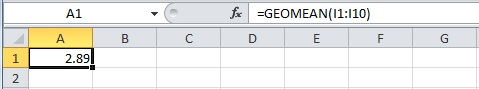
Thus, the geometric mean for the number of empty seats on Monday is 2.89.
Midrange:
Software procedure:
Step-by-step software procedure to obtain Midrange using EXCEL software is as follows:
- Open an EXCEL file.
- Enter the data in the column I in cells I1 to I10.
- In cell A1, enter the formula “=(MIN(I1:I10)+MAX(I1:I10))/2”.
- Output using EXCEL software is given below:
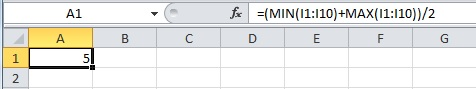
- Thus, the midrange for the number of empty seats on Monday is 5.
10% Trimmed mean:
Software procedure:
Step-by-step software procedure to obtain 10% Trimmed mean using EXCEL software is as follows:
- Open an EXCEL file.
- Enter the data in the column I in cells I1 to I10.
- In cell A1, enter the formula “=TRIMMEAN(I1:I10,0.2)”.
- Output using EXCEL software is given below:
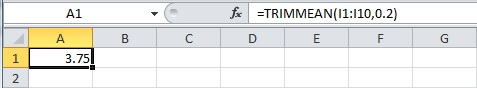
- Thus, the 10% Trimmed mean for the number of empty seats on Monday is 3.75.
For Tuesday:
Mean:
Software procedure:
Step-by-step software procedure to obtain Mean using EXCEL software is as follows:
- Open an EXCEL file.
- Enter the data in the column J in cells J1 to J10.
- In cell A1, enter the formula “=AVERAGE(J1:J10)”.
- Output using EXCEL software is given below:
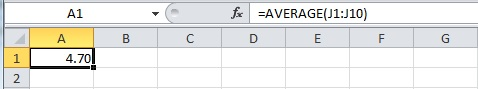
Thus, the mean number of empty seats on Tuesday is 4.70.
Median:
Software procedure:
Step-by-step software procedure to obtain Median using EXCEL software is as follows:
- Open an EXCEL file.
- Enter the data in the column J in cells J1 to J10.
- In cell A1, enter the formula “=MEDIAN(J1:J10)”.
- Output using EXCEL software is given below:
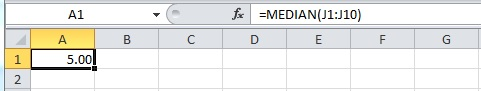
Thus, the median for the number of empty seats on Tuesday is 5.
Mode:
Software procedure:
Step-by-step software procedure to obtain Mode using EXCEL software is as follows:
- Open an EXCEL file.
- Enter the data in the column J in cells J1 to J10.
- In cell A1, enter the formula “=MODE.SNGL(J1:J10)”.
- Output using EXCEL software is given below:
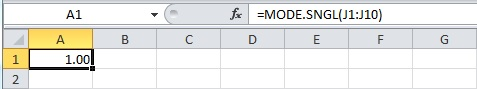
Thus, the mode for the number of empty seat on Tuesday is 1.
Geometric mean:
Software procedure:
Step-by-step software procedure to obtain Geometric mean using EXCEL software is as follows:
- Open an EXCEL file.
- Enter the data in the column J in cells J1 to J10.
- In cell A1, enter the formula “=GEOMEAN(J1:J10)”.
- Output using EXCEL software is given below:
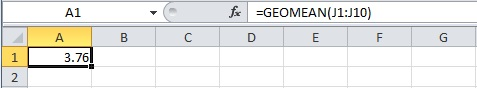
Thus, the geometric mean for the number of empty seats on Tuesday is 3.76.
Midrange:
Software procedure:
Step-by-step software procedure to obtain Midrange using EXCEL software is as follows:
- Open an EXCEL file.
- Enter the data in the column J in cells J1 to J10.
- In cell A1, enter the formula “=(MIN(J1:J10)+MAX(J1:J10))/2”.
- Output using EXCEL software is given below:
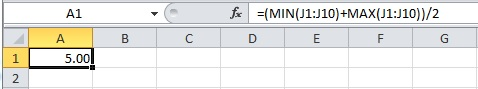
- Thus, the midrange for the number of empty seats on Tuesday is 5.
10% Trimmed mean:
Software procedure:
Step-by-step software procedure to obtain 10% Trimmed mean using EXCEL software is as follows:
- Open an EXCEL file.
- Enter the data in the column J in cells J1 to J10.
- In cell A1, enter the formula “=TRIMMEAN(J1:J10,0.2)”.
- Output using EXCEL software is given below:
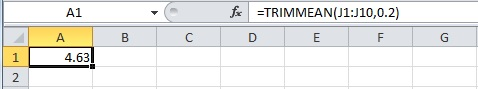
- Thus, the 10% Trimmed mean for the number of empty seats on Tuesday is 4.63.
For Wednesday:
Mean:
Software procedure:
Step-by-step software procedure to obtain Mean using EXCEL software is as follows:
- Open an EXCEL file.
- Enter the data in the column K in cells K1 to K10.
- In cell A1, enter the formula “=AVERAGE(K1:K10)”.
- Output using EXCEL software is given below:

Thus, the mean number of empty seats on Wednesday is 3.80.
Median:
Software procedure:
Step-by-step software procedure to obtain Median using EXCEL software is as follows:
- Open an EXCEL file.
- Enter the data in the column K in cells K1 to K10.
- In cell A1, enter the formula “=MEDIAN(K1:K10)”.
- Output using EXCEL software is given below:
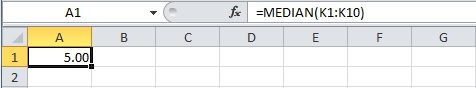
Thus, the median for the number of empty seats on Wednesday is 5.
Mode:
Software procedure:
Step-by-step software procedure to obtain Mode using EXCEL software is as follows:
- Open an EXCEL file.
- Enter the data in the column K in cells K1 to K10.
- In cell A1, enter the formula “=MODE.SNGL(K1:K10)”.
- Output using EXCEL software is given below:
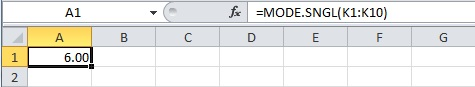
Thus, the mode for the number of empty seat on Wednesday is 6.
Geometric mean:
- Here, the data set on Wednesday contains zero, so, geometric mean is not applicable.
Midrange:
Software procedure:
Step-by-step software procedure to obtain Midrange using EXCEL software is as follows:
- Open an EXCEL file.
- Enter the data in the column K in cells K1 to K10.
- In cell A1, enter the formula “=(MIN(K1:K10)+MAX(K1:K10))/2”.
- Output using EXCEL software is given below:
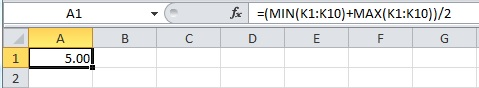
- Thus, the midrange for the number of empty seats on Wednesday is 5.
10% Trimmed mean:
Software procedure:
Step-by-step software procedure to obtain 10% Trimmed mean using EXCEL software is as follows:
- Open an EXCEL file.
- Enter the data in the column K in cells K1 to K10.
- In cell A1, enter the formula “=TRIMMEAN(K1:K10,0.2)”.
- Output using EXCEL software is given below:
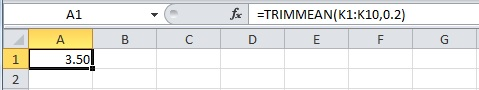
- Thus, the 10% Trimmed mean for the number of empty seats on Wednesday is 3.50.
For Thursday:
Mean:
Software procedure:
Step-by-step software procedure to obtain Mean using EXCEL software is as follows:
- Open an EXCEL file.
- Enter the data in the column L in cells L1 to L10.
- In cell A1, enter the formula “=AVERAGE(L1:L10)”.
- Output using EXCEL software is given below:
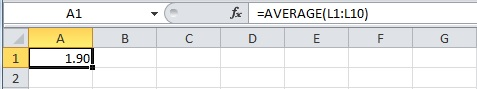
Thus, the mean number of empty seats on Thursday is 1.90.
Median:
Software procedure:
Step-by-step software procedure to obtain Median using EXCEL software is as follows:
- Open an EXCEL file.
- Enter the data in the column L in cells L1 to L10.
- In cell A1, enter the formula “=MEDIAN(L1:L10)”.
- Output using EXCEL software is given below:
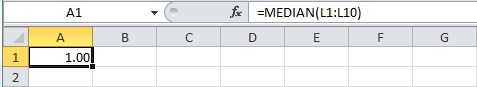
Thus, the median for the number of empty seats on Thursday is 5.
Mode:
Software procedure:
Step-by-step software procedure to obtain Mode using EXCEL software is as follows:
- Open an EXCEL file.
- Enter the data in the column L in cells L1 to L10.
- In cell A1, enter the formula “=MODE.SNGL(L1:L10)”.
- Output using EXCEL software is given below:
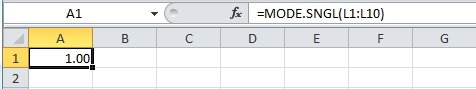
Thus, the mode for the number of empty seat on Thursday is 1.
Geometric mean:
Software procedure:
Step-by-step software procedure to obtain Geometric mean using EXCEL software is as follows:
- Open an EXCEL file.
- Enter the data in the column L in cells L1 to L10.
- In cell A1, enter the formula “=GEOMEAN(L1:L10)”.
- Output using EXCEL software is given below:
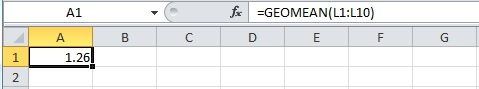
Thus, the geometric mean for the number of empty seats on Thursday is 1.26.
Midrange:
Software procedure:
Step-by-step software procedure to obtain Midrange using EXCEL software is as follows:
- Open an EXCEL file.
- Enter the data in the column L in cells L1 to L10.
- In cell A1, enter the formula “=(MIN(L1:L10)+MAX(L1:L10))/2”.
- Output using EXCEL software is given below:
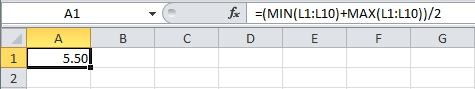
- Thus, the midrange for the number of empty seats on Thursday is 5.50.
10% Trimmed mean:
Software procedure:
Step-by-step software procedure to obtain 10% Trimmed mean using EXCEL software is as follows:
- Open an EXCEL file.
- Enter the data in the column L in cells L1 to L10.
- In cell A1, enter the formula “=TRIMMEAN(L1:L10,0.2)”.
- Output using EXCEL software is given below:
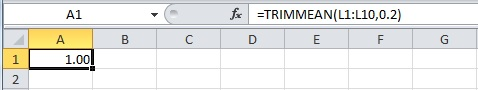
- Thus, the 10% Trimmed mean for the number of empty seats on Thursday is 1.
b.
Explain whether or not the measures of center agreed.
Answer to Problem 16SE
No, the measures of center are not agreed.
Explanation of Solution
The measures of center will not acceptable for the number of empty seats on flight 308. In this situation, the mode and geometric mean are totally different from the other measures. That is, the mean, median and the midrange for all days in a week has the similar values.
c.
Note the strength or weakness of the statistic of center.
Explanation of Solution
Strength of the statistic of the center:
Mean: it is more preferable for any statistical analysis which uses all information about the sample data.
Median: median will be more unaffected by the extreme values.
Mode: Of all the observations, mode is the undependable measure of center.
Weakness of the statistic of the center:
Mean: it is affected by the extreme values.
Median: it is affected by the gaps in the data value.
Mode: it is not helpful for continuous data.
When the strength or weakness is observed for each day, it is known that mode is the undependable for all the days. It is observed from the previous part (b), the mean and median are equal for all the days, so it acts as the strength of the statistic of center.
Want to see more full solutions like this?
Chapter 4 Solutions
Applied Statistics in Business and Economics


- I need help with this problem and an explanation of the solution for the image described below. (Statistics: Engineering Probabilities)arrow_forwardI need help with this problem and an explanation of the solution for the image described below. (Statistics: Engineering Probabilities)arrow_forwardDATA TABLE VALUES Meal Price ($) 22.78 31.90 33.89 22.77 18.04 23.29 35.28 42.38 36.88 38.55 41.68 25.73 34.19 31.75 25.24 26.32 19.57 36.57 32.97 36.83 30.17 37.29 25.37 24.71 28.79 32.83 43.00 35.23 34.76 33.06 27.73 31.89 38.47 39.42 40.72 43.92 36.51 45.25 33.51 29.17 30.54 26.74 37.93arrow_forward
- I need help with this problem and an explanation of the solution for the image described below. (Statistics: Engineering Probabilities)arrow_forwardSales personnel for Skillings Distributors submit weekly reports listing the customer contacts made during the week. A sample of 65 weekly reports showed a sample mean of 19.5 customer contacts per week. The sample standard deviation was 5.2. Provide 90% and 95% confidence intervals for the population mean number of weekly customer contacts for the sales personnel. 90% Confidence interval, to 2 decimals: ( , ) 95% Confidence interval, to 2 decimals:arrow_forwardA simple random sample of 40 items resulted in a sample mean of 25. The population standard deviation is 5. a. What is the standard error of the mean (to 2 decimals)? b. At 95% confidence, what is the margin of error (to 2 decimals)?arrow_forward
- mean trough level of the population to be 3.7 micrograms/mL. The researcher conducts a study among 93 newly diagnosed arthritis patients and finds the mean trough to be 4.1 micrograms/mL with a standard deviation of 2.4 micrograms/mL. The researcher wants to test at the 5% level of significance if the trough is different than previously reported or not. Z statistics will be used. Complete Step 5 of hypothesis testing: Conclusion. State whether or not you would reject the null hypothesis and why. Also interpret what this means (i.e. is the mean trough different from 3.7 or noarrow_forward30% of all college students major in STEM (Science, Technology, Engineering, and Math). If 48 college students are randomly selected, find the probability thata. Exactly 12 of them major in STEM. b. At most 17 of them major in STEM. c. At least 12 of them major in STEM. d. Between 9 and 13 (including 9 and 13) of them major in STEM.arrow_forward7% of all Americans live in poverty. If 40 Americans are randomly selected, find the probability thata. Exactly 4 of them live in poverty. b. At most 1 of them live in poverty. c. At least 1 of them live in poverty. d. Between 2 and 9 (including 2 and 9) of them live in poverty.arrow_forward
- 48% of all violent felons in the prison system are repeat offenders. If 40 violent felons are randomly selected, find the probability that a. Exactly 18 of them are repeat offenders. b. At most 18 of them are repeat offenders. c. At least 18 of them are repeat offenders. d. Between 17 and 21 (including 17 and 21) of them are repeat offenders.arrow_forwardConsider an MA(6) model with θ1 = 0.5, θ2 = −25, θ3 = 0.125, θ4 = −0.0625, θ5 = 0.03125, and θ6 = −0.015625. Find a much simpler model that has nearly the same ψ-weights.arrow_forwardLet {Yt} be an AR(2) process of the special form Yt = φ2Yt − 2 + et. Use first principles to find the range of values of φ2 for which the process is stationary.arrow_forward
 Glencoe Algebra 1, Student Edition, 9780079039897...AlgebraISBN:9780079039897Author:CarterPublisher:McGraw Hill
 Big Ideas Math A Bridge To Success Algebra 1: Stu...AlgebraISBN:9781680331141Author:HOUGHTON MIFFLIN HARCOURTPublisher:Houghton Mifflin Harcourt
 Holt Mcdougal Larson Pre-algebra: Student Edition...AlgebraISBN:9780547587776Author:HOLT MCDOUGALPublisher:HOLT MCDOUGAL
 College Algebra (MindTap Course List)AlgebraISBN:9781305652231Author:R. David Gustafson, Jeff HughesPublisher:Cengage Learning