Concept explainers
Videos
(a)
The magnitude of the force
(a)
Answer to Problem 72P
The net force on the top link is
Explanation of Solution
Given:
The mass of each link is
The upward acceleration of the chain is
Formula used:
The diagram for the five chains linked to each other and the force that is exerted on the link one and two is shown in Figure 1
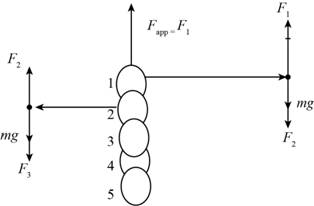
Figure 1
In the above figure, the force applied on the top link of the chain is
The expression for the net force exerted on the top link is given by,
Calculation:
The net force on the top link is calculated as,
Conclusion:
Therefore, the net force on the top link is
(b)
The net force on each of the link.
(b)
Answer to Problem 72P
The net force that acts on each of the link is
Explanation of Solution
Formula used:
The expression for the net force on each of the link is given by,
Calculation:
The net force on each of the link is given by,
Conclusion:
Therefore, the net force that acts on each of the link is
(c)
The magnitude of the force that each link exerts on the link below it.
(c)
Answer to Problem 72P
The force exerted on the second link is
Explanation of Solution
Formula used:
The expression for the net force exerted by the top link on the link below it is given by,
The expression for the net for exerted by the second link on the third link is given by,
The expression for the force exerted by the third link on the fourth link is given by,
The expression for the force exerted by the fourth link on the last link is given by,
Calculation:
The force exerted by the first link on the second link is calculated as,
The force exerted by the second link on the third link is calculated as,
The force exerted by the third link on the fourth link is calculated as,
The force exerted by the fourth link on the last link is calculated as,
Conclusion:
Therefore, the force exerted on the second link is
Want to see more full solutions like this?
Chapter 4 Solutions
PHYSICS F/SCI.+ENGRS.,STAND.-W/ACCESS


- Can you solve this 2 question and teach me using ( engineer method formula)arrow_forward11. If all three collisions in the figure below are totally inelastic, which brings the car of mass (m) on the left to a halt? I m II III m m ע ע ע brick wall 0.5v 2m 2v 0.5m A. I B. II C. III D. I and II E. II and III F. I and III G. I, II and III (all of them)arrow_forwardHow can you tell which vowel is being produced here ( “ee,” “ah,” or “oo”)? Also, how would you be able to tell for the other vowels?arrow_forward
- You want to fabricate a soft microfluidic chip like the one below. How would you go about fabricating this chip knowing that you are targeting a channel with a square cross-sectional profile of 200 μm by 200 μm. What materials and steps would you use and why? Disregard the process to form the inlet and outlet. Square Cross Sectionarrow_forward1. What are the key steps involved in the fabrication of a semiconductor device. 2. You are hired by a chip manufacturing company, and you are asked to prepare a silicon wafer with the pattern below. Describe the process you would use. High Aspect Ratio Trenches Undoped Si Wafer P-doped Si 3. You would like to deposit material within a high aspect ratio trench. What approach would you use and why? 4. A person is setting up a small clean room space to carry out an outreach activity to educate high school students about patterning using photolithography. They obtained a positive photoresist, a used spin coater, a high energy light lamp for exposure and ordered a plastic transparency mask with a pattern on it to reduce cost. Upon trying this set up multiple times they find that the full resist gets developed, and they are unable to transfer the pattern onto the resist. Help them troubleshoot and find out why pattern of transfer has not been successful. 5. You are given a composite…arrow_forwardTwo complex values are z1=8 + 8i, z2=15 + 7 i. z1∗ and z2∗ are the complex conjugate values. Any complex value can be expessed in the form of a+bi=reiθ. Find r and θ for (z1-z∗2)/z1+z2∗. Find r and θ for (z1−z2∗)z1z2∗ Please show all stepsarrow_forward
- An electromagnetic wave is traveling through vacuum in the positive x direction. Its electric field vector is given by E=E0sin(kx−ωt)j^,where j^ is the unit vector in the y direction. If B0 is the amplitude of the magnetic field vector, find the complete expression for the magnetic field vector B→ of the wave. What is the Poynting vector S(x,t), that is, the power per unit area associated with the electromagnetic wave described in the problem introduction? Give your answer in terms of some or all of the variables E0, B0, k, x, ω, t, and μ0. Specify the direction of the Poynting vector using the unit vectors i^, j^, and k^ as appropriate. Please explain all stepsarrow_forwardAnother worker is performing a task with an RWL of only 9 kg and is lifting 18 kg, giving him an LI of 2.0 (high risk). Questions:What is the primary issue according to NIOSH?Name two factors of the RWL that could be improved to reduce risk.If the horizontal distance is reduced from 50 cm to 30 cm, how does the HM change and what effect would it have?arrow_forwardTwo complex values are z1=8 + 8i, z2=15 + 7 i. z1∗ and z2∗ are the complex conjugate values. Any complex value can be expessed in the form of a+bi=reiθ. Find r and θ for z1z2∗. Find r and θ for z1/z2∗? Find r and θ for (z1−z2)∗/z1+z2∗. Find r and θ for (z1−z2)∗/z1z2∗ Please explain all steps, Thank youarrow_forward
- An ac series circuit consists of a voltage source of frequency 60 Hz and voltage amplitude V, a 505-Ω resistor, and a capacitor of capacitance 7.2 μF. What must be the source voltage amplitude V for the average electrical power consumed in the resistor to be 236 W? There is no inductance in the circuit.arrow_forwardAn L−R−C series circuit has R= 280 Ω . At the frequency of the source, the inductor has reactance XLL= 905 Ω and the capacitor has reactance XC= 485 Ω . The amplitude of the voltage across the inductor is 445 V . What is the amplitude of the voltage across the resistor and the capacitor? What is the voltage amplitude of the source? What is the rate at which the source is delivering electrical energy to the circuit?arrow_forwardA 0.185 H inductor is connected in series with a 98.5 Ω resistor and an ac source. The voltage across the inductor is vL=−(12.5V)sin[(476rad/s)t]vL. Derive an expression for the voltage vR across the resistor. Express your answer in terms of the variables L, R, VL (amplitude of the voltage across the inductor), ω, and t. What is vR at 2.13 ms ? Please explain all stepsarrow_forward
 Principles of Physics: A Calculus-Based TextPhysicsISBN:9781133104261Author:Raymond A. Serway, John W. JewettPublisher:Cengage Learning
 Physics for Scientists and Engineers with Modern ...PhysicsISBN:9781337553292Author:Raymond A. Serway, John W. JewettPublisher:Cengage Learning
 Physics for Scientists and Engineers: Foundations...PhysicsISBN:9781133939146Author:Katz, Debora M.Publisher:Cengage Learning
 College PhysicsPhysicsISBN:9781305952300Author:Raymond A. Serway, Chris VuillePublisher:Cengage Learning
 College PhysicsPhysicsISBN:9781285737027Author:Raymond A. Serway, Chris VuillePublisher:Cengage Learning
 Physics for Scientists and Engineers, Technology ...PhysicsISBN:9781305116399Author:Raymond A. Serway, John W. JewettPublisher:Cengage Learning