Videos
Conducting a Financial Ratio Analysis on HP INC.
Use online resources to work on this chapter's questions. Please note that website information changes over time, and these changes may limit your ability to answer some of these questions.
In Chapter 3, we looked at Dunkin' Brands' financial statements. In this chapter, we will use financial Internet websites (specifically, www.morningstar.com and www.google.com/finance) to analyze HP Inc., a computer hardware company. Once on either website, you simply enter HP Inc.'s ticker symbol (HPQ) to obtain the financial information needed.
The text mentions that financial statement analysis has two major components: a trend analysis, where we evaluate changes in key ratios over time, and a freer analysis, where we compare financial ratios with firms that are in the same industry and/or line of business. We will do both of these types of analysis in this problem.
Through the Morningstar website, you can find the firm's financials (Income Statement,
On the Google Finance site, you can find the firm’s financial statements for the four most recent years or the five most recent quarters and key financial data for related companies for the most recent year or quarter. We will use the related companies' annual data to conduct the firm's peer analysis. Notice that when you go to the "Related Companies" screen, you can "add or remove columns." Click on that phrase, and you can check which peer data items you'd like to show on tire computer screen. Also, once you have chosen the data, you can click on a term, and the companies will be ranked in either ascending or descending order for tire specific term selected.
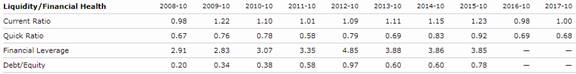
2. Looking at Morningstar's Financial Health ratios, what has happened to HP's financial leverage position over tire past 10 years?
Want to see the full answer?
Check out a sample textbook solution
Chapter 4 Solutions
Fundamentals of Financial Management (MindTap Course List)


- Explain the understanding (or misunderstanding) of the working poor with tax return preparation within one page report.arrow_forwardExplain the regulations or requirements for tax return preparers in Alabama.arrow_forwardquestion 1. Toodles Inc. had sales of $1,840,000. Cost of goods sold, administrative and selling expenses, and depreciation expenses were $1,180,000, $185,000 and $365,000 respectively. In addition, the company had an interest expense of $280,000 and a tax rate of 35 percent. (Ignore any tax loss carry-back or carry-forward provisions.)Arrange the financial information for Toodles Inc. in an income statement and compute its OCF?Question 2 Anti-Pandemic Pharma Co. Ltd. reports the following information in its income statement: Sales = $5,250,000;Costs = $2, 173,000;Other expenses = $187,400; Depreciation expense = $79,000; Interest expense= $53,555; Taxes = $76,000; Dividends = $69,000. $136,700 worth of new shares were also issued during the year and long-term debt worth $65,300 was redeemed.a) Compute the cash flow from assetsb) Compute the net change in working capitalQuestion 3Footfall Manufacturing Ltd. reports the following financial information at the end of the current year:…arrow_forward
- Accrued Interest PayableCompute the interest for December accrued on each of the following notes payable owed by Riff-Raff'n Yell Inc., on December 31: Day of Calendar: 1 Lender: New Age Principal: $10,000 Interest Rate: 5% Term (Days) 120 Day of Calendar: 8 Lender: Wyvern Tavern Principal: $8,000 Interest Rate: 6% Term (Days) 90 Day of Calendar: 17 Lender: Cedar Tree Principal: $15,000 Interest Rate: 4% Term (Days) 90 Note: Use 360 days for calculations and round to the nearest dollar. Riff-Raff'n Yell, Inc. Lender (in alphabetical order) Accrued Interest Cedar Tree Answer 1 New Age Answer 2 Wyvern Tavern Answer 3arrow_forwardQuestion Footfall afacturing pers The following fancial information at the end of the current years Inventory turnover ratio Fixed accetturnover ratio bot to assets ratia set profit ang ross profit margin the given information to fill at the templates for income statement and balance sheet geb In Statement of Footfall Manufacturing Ltd. for the year ending RELEASED BY THE CL MOME2003, FEBRUARY 9, 3005 Sales December 31, 20 Cast of other expec Earnings befo Camings afterarrow_forwardTreasury securities are issued and backed by the U.S. government and, therefore, are considered to be the lowest-risk securities on the market. As an investor looking for protection against inflation, you are considering the purchase of inflation-adjusted bonds known as U.S. Treasury Inflation-Protected Securities (TIPS). With these securities, the face value (which is paid at maturity) and the bond interest rate (which is paid semiannually) is regularly adjusted to account for inflation. However, for this problem only, assume the semi-annual interest payment (called the bond dividend) remains the same. You purchased a 10-year $10,000 TIPS bond with dividend of 4% per year payable semiannually (i.e., $200 every 6 months). Assume there is no inflation adjustment for the first 5 years, but in years 6 through 10, the bond face value increases by $850 each year. You use an expected investment return of 11% per year compounded semiannually. NOTE: This is a multi-part question. Once an…arrow_forward
- Nataro, Incorporated, has sales of $698,000, costs of $344,000, depreciation expense of $89,000, interest expense of $54,000, and a tax rate of 21 percent. What is the net income for this firm? Note: Do not round intermediate calculations and round your answer to the nearest whole number, e.g., 32. Net incomearrow_forwardGreenland is a small country with only listed stocks on its stock exchange. Using the following data create a market capitalisation index. Stock Price on Index Creation Number of Shares issued Day $45 300 B $70 500 C $18 600 D $11 900 If the value of the stock index is set at 100 on the index creation date, what will be the value of the index when stock prices are the following: Stock A Stock Price $35 B $78 C $15 D $9arrow_forwardLight Sweet Petroleum, Inc., is trying to evaluate a generation project with the following cash flows. If the company requires a return of 12 percent on its investments, what is the project's NPV? What are the IRRS for the project? Year 0 $ (45,000,000) Year 1 $ 71,000,000 Year 2 $ (15,000,000) Required return 12% Complete the following analysis. Do not hard code values in your calculations. Use a "Guess" of .99 to calculate the higher IRR and -.99 to calculate the lower IRR. You must use the built-in Excel functions to answer this question. NPV Higher IRR Lower IRRarrow_forward
- Bethesda Mining Company reports the following balance sheet information for 2021 and 2022: Assets Current assets 2021 BETHESDA MINING COMPANY Balance Sheets as of December 31, 2021 and 2022 Liabilities and Owners' Equity Current liabilities Accounts payable Notes payable 2021 $ 190,422 85,520 2022 Cash Accounts receivable Inventory $ 47,858 61,781 124,912 $ 60,783 82,139 190,747 Total $ 275,942 Total $ 234,551 $ 333,669 Long-term debt $ 238,000 Owners' equity Fixed assets Common stock and paid-in surplus Accumulated retained earnings $ 217,000 161,656 Net plant and equipment Total assets $ 658,047 $ 589,628 $ 378,656 $ 892,598 $ 923,297 Total liabilities and owners' equity $ 892,598 Total 2022 $ 198,111 137,088 $ 335,199 $ 174,750 $ 217,000 196,348 $ 413,348 $ 923,297 Based on the balance sheets given, calculate the following financial ratios for each year: Calculate the following financial ratios for each year: a. Current ratio. Note: Do not round intermediate calculations and round…arrow_forwardMary decides to buy a Treasury note futures contract for delivery of $100,000 face amount in September, at a price of 120′24.0. At the same time, Eric decides to sell a Treasury note futures contract if he can get a price of 120′24.0 or higher. The exchange, in turn, agrees to sell one Treasury note contract to Mary at 120′24.0 and to buy one contract from Eric at 120′24.0. The price of the Treasury note decreases to 120′10.5. Calculate Eric's balance on margin account. Assume that initial margin is $1,890. Please note that loss should be entered with minus sign. Round the answer to two decimal places.arrow_forwardDon't used hand raiting and don't used Ai solutionarrow_forward
 Fundamentals of Financial Management (MindTap Cou...FinanceISBN:9781285867977Author:Eugene F. Brigham, Joel F. HoustonPublisher:Cengage Learning
 Fundamentals of Financial Management (MindTap Cou...FinanceISBN:9781337395250Author:Eugene F. Brigham, Joel F. HoustonPublisher:Cengage Learning
 Fundamentals of Financial Management, Concise Edi...FinanceISBN:9781305635937Author:Eugene F. Brigham, Joel F. HoustonPublisher:Cengage Learning
 Pkg Acc Infor Systems MS VISIO CDFinanceISBN:9781133935940Author:Ulric J. GelinasPublisher:CENGAGE L
 Principles of Accounting Volume 1AccountingISBN:9781947172685Author:OpenStaxPublisher:OpenStax College
 Auditing: A Risk Based-Approach (MindTap Course L...AccountingISBN:9781337619455Author:Karla M Johnstone, Audrey A. Gramling, Larry E. RittenbergPublisher:Cengage Learning