
College Algebra
1st Edition
ISBN: 9781938168383
Author: Jay Abramson
Publisher: OpenStax
expand_more
expand_more
format_list_bulleted
Concept explainers
Videos
Textbook Question
Chapter 4, Problem 27PT
For the following exercises, use the graph in Figure 3, showing the profit, y, in thousands of dollars, of a company in a given year, x, where x represents years since 1980.
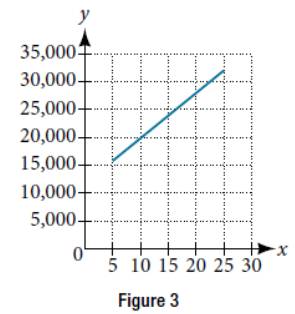
27. Draw a best-fit line for the plotted data.
Expert Solution & Answer
Want to see the full answer?
Check out a sample textbook solution
Students have asked these similar questions
1) Express these large and small numbers from the Read and Study section in scientific
notation:
(a) 239,000 miles
(b) 3,800,000,000,000 sheets of paper
(c) 0.0000000000000000000000167 grams
2) Find all values for the variable x that make these equations true.
(a) 5x = 1
(b) 3x = 1/1
9
(c) 4* = 11/
4
(e) 4* = 64
(g) 10x = 1,000,000
(d) 3x=-3
(f) 2x =
=
8
(h) 10x = 0.001
(b)
4) Find an equation to fit each of the following graphs:
(a)
20
20
18
16
14
12
10
8
6
4
2
24
22
20
18
16
14
12
10
8
16
A
2
-3 -2
-1-0
2
3
4.
-1
0
1
2
3.
-2
-2
3) Which of the following are equivalent to 3? (There may be more than one that is
equivalent!)
-1
(a) (9)¯¹
3.
(b) (-3)-1
(c) (-3)
-1
(d) -(¯3)
(e) 11
3-1
(f) 3-4
Chapter 4 Solutions
College Algebra
Ch. 4.1 - If f(x) is a linear function, and (2,3) and (0,4)...Ch. 4.1 - The population of a small town increased from...Ch. 4.1 - If f(x) is a linear function, with f(2)=11, and...Ch. 4.1 - A new plant food was introduced to a young tree to...Ch. 4.1 - Graph f(x)=34x+6 by plotting points.Ch. 4.1 - Find a point on the graph we drew in Example 12...Ch. 4.1 - Graph f(x)=4+2x, using transformations.Ch. 4.1 - Find the x-intercept of f(x)=14x4.Ch. 4.1 - Given the function h(x)=2x4, write an equation for...Ch. 4.1 - A line passes through the points, (2,15) and...
Ch. 4.1 - Terry is skiing down a steep hill. Terry’s...Ch. 4.1 - Jessica is walking home from a friend’s...Ch. 4.1 - A boat is 100 miles away from the marina,...Ch. 4.1 - If the graphs of two linear functions...Ch. 4.1 - Ifa horizontal line has the equation f(x)=a and...Ch. 4.1 - For the following exercises, determine whether the...Ch. 4.1 - For the following exercises, determine whether the...Ch. 4.1 - For the following exercises, determine whether the...Ch. 4.1 - For the following exercises, determine whether the...Ch. 4.1 - For the following exercises, determine whether the...Ch. 4.1 - For the following exercises, determine whether the...Ch. 4.1 - For the following exercises, determine whether the...Ch. 4.1 - For the following exercises, determine whether the...Ch. 4.1 - For the following exercises, determine whether...Ch. 4.1 - For the following exercises, determine whether...Ch. 4.1 - For the following exercises, determine whether...Ch. 4.1 - For the following exercises, determine whether...Ch. 4.1 - For the following exercises, determine whether...Ch. 4.1 - For the following exercises, determine whether...Ch. 4.1 - For the following exercises, determine whether...Ch. 4.1 - For the following exercises, determine whether...Ch. 4.1 - For the following exercises, determine whether...Ch. 4.1 - For the following exercises, determine whether...Ch. 4.1 - For the following exercises, find the slope of the...Ch. 4.1 - For the following exercises, find the slope of the...Ch. 4.1 - For the following exercises, find the slope of the...Ch. 4.1 - For the following exercises, find the slope of the...Ch. 4.1 - For the following exercises, find the slope of the...Ch. 4.1 - For the following exercises, given each set of...Ch. 4.1 - For the following exercises, given each set of...Ch. 4.1 - For the following exercises, given each set of...Ch. 4.1 - For the following exercises, given each set of...Ch. 4.1 - For the following exercises, given each set of...Ch. 4.1 - For the following exercises, given each set of...Ch. 4.1 - For the following exercises, given each set of...Ch. 4.1 - For the following exercises, given each set of...Ch. 4.1 - For the following exercises, determine whether the...Ch. 4.1 - For the following exercises, determine whether the...Ch. 4.1 - For the following exercises, determine whether the...Ch. 4.1 - For the following exercises, determine whether the...Ch. 4.1 - For the following exercises, find the x-and...Ch. 4.1 - For the following exercises, find the x- and...Ch. 4.1 - For the following exercises, find the x-and...Ch. 4.1 - For the following exercises, find the x-and...Ch. 4.1 - For the following exercises, find the x-and...Ch. 4.1 - For the following exercises, find the x-and...Ch. 4.1 - For the following exercises, use the descriptions...Ch. 4.1 - For the following exercises, use the descriptions...Ch. 4.1 - For the following exercises, use the descriptions...Ch. 4.1 - For the following exercises, use the descriptions...Ch. 4.1 - For the following exercises, use the descriptions...Ch. 4.1 - For the following exercises, write an equation for...Ch. 4.1 - For the following exercises, write an equation for...Ch. 4.1 - For the following exercises, write an equation for...Ch. 4.1 - For the following exercises, write an equation for...Ch. 4.1 - For the following exercises, find the slope of the...Ch. 4.1 - For the following exercises, find the slope of the...Ch. 4.1 - For the following exercises, write an equation for...Ch. 4.1 - For the following exercises, write an equation for...Ch. 4.1 - For the following exercises, write an equation for...Ch. 4.1 - For the following exercises, write an equation for...Ch. 4.1 - For the following exercises, write an equation for...Ch. 4.1 - For the following exercises, write an equation for...Ch. 4.1 - For the following exercises, match the given...Ch. 4.1 - For the following exercises, match the given...Ch. 4.1 - For the following exercises, match the given...Ch. 4.1 - For the following exercises, match the given...Ch. 4.1 - For the following exercises, match the given...Ch. 4.1 - For the following exercises, match the given...Ch. 4.1 - For the following exercises, sketch a line with...Ch. 4.1 - For the following exercises, sketch a line with...Ch. 4.1 - For the following exercises, sketch a line with...Ch. 4.1 - For the following exercises, sketch a line with...Ch. 4.1 - For the following exercises, sketch a line with...Ch. 4.1 - For the following exercises, sketch a line with...Ch. 4.1 - For the following exercises, sketch the graph of...Ch. 4.1 - For the following exercises, sketch the graph of...Ch. 4.1 - For the following exercises, sketch the graph of...Ch. 4.1 - For the following exercises, sketch the graph of...Ch. 4.1 - For the following exercises, sketch the graph of...Ch. 4.1 - For the following exercises, sketch the graph of...Ch. 4.1 - For the following exercises, sketch the graph of...Ch. 4.1 - For the following exercises, sketch the graph of...Ch. 4.1 - For the following exercises, sketch the graph of...Ch. 4.1 - For the following exercises, write the equation of...Ch. 4.1 - For the following exercises, write the equation of...Ch. 4.1 - For the following exercises, write the equation of...Ch. 4.1 - For the following exercises, write the equation of...Ch. 4.1 - For the following exercises, which of the tables...Ch. 4.1 - For the following exercises, which of the tables...Ch. 4.1 - For the following exercises, which of the tables...Ch. 4.1 - For the following exercises, which of the tables...Ch. 4.1 - For the following exercises, which of the tables...Ch. 4.1 - For the following exercises, which of the tables...Ch. 4.1 - For the following exercises, which of the tables...Ch. 4.1 - For the following exercises, which of the tables...Ch. 4.1 - For the following exercises, use a calculator or...Ch. 4.1 - For the following exercises, use a calculator or...Ch. 4.1 - For the following exercises, use a calculator or...Ch. 4.1 - For the following exercises, use a calculator or...Ch. 4.1 - For the following exercises, use a calculator or...Ch. 4.1 - For the following exercises, use a calculator or...Ch. 4.1 - For the following exercises, use a calculator or...Ch. 4.1 - For the following exercises, use a calculator or...Ch. 4.1 - Find the value ofx if a linear function goes...Ch. 4.1 - Find the value ofy if a linear function goes...Ch. 4.1 - Find the equation of the line that passes...Ch. 4.1 - Find the equation of the line that passes...Ch. 4.1 - Find the equation of the line that passes...Ch. 4.1 - Find the equation of the line parallel to the line...Ch. 4.1 - Find the equation of the line perpendicular to the...Ch. 4.1 - For the following exercises, use the functions...Ch. 4.1 - For the following exercises, use the functions...Ch. 4.1 - At noon, a barista notices that she has 20 in...Ch. 4.1 - A gym membership with two personal...Ch. 4.1 - A clothing business finds there is a...Ch. 4.1 - A phone company charges for service accordingto...Ch. 4.1 - A farmer finds there is a linear relationship...Ch. 4.1 - A city’s population in the year 1960 was...Ch. 4.1 - A town’s population has been growing linearly.In...Ch. 4.1 - Suppose that average annual income (in dollars)...Ch. 4.1 - When temperature is 0 degrees Celsius,...Ch. 4.2 - A company sells doughnuts. They incur a fixed cost...Ch. 4.2 - A city’s population has been growing linearly. In...Ch. 4.2 - Try it #3 There is a straight road leading from...Ch. 4.2 - Explain how to find the input variable in a word...Ch. 4.2 - Explain how to find the output variable in a wordp...Ch. 4.2 - Explain how to interpret the initial value in a...Ch. 4.2 - Explain how to determine the slope in a...Ch. 4.2 - Find the area of a parallelogram bounded by...Ch. 4.2 - Find the area of a triangle bounded by the...Ch. 4.2 - Find the area of a triangle bounded by the...Ch. 4.2 - Find the area of a parallelogram bounded by...Ch. 4.2 - For the following exercises, consider this...Ch. 4.2 - For the following exercises, consider this...Ch. 4.2 - For the following exercises, consider this...Ch. 4.2 - For the following exercises, consider this...Ch. 4.2 - For the following exercises, consider this...Ch. 4.2 - For the following exercises, consider this...Ch. 4.2 - For the following exercises, consider this...Ch. 4.2 - For the following exercises, consider this...Ch. 4.2 - For the following exercises, consider this...Ch. 4.2 - For the following exercises, consider this...Ch. 4.2 - For the following exercises, consider this...Ch. 4.2 - For the following exercises, consider this...Ch. 4.2 - For the following exercises, consider this...Ch. 4.2 - For the following exercises, consider this...Ch. 4.2 - For the following exercises, consider this...Ch. 4.2 - For the following exercises, consider this...Ch. 4.2 - For the following exercises, consider this...Ch. 4.2 - For the following exercises, consider this...Ch. 4.2 - For the following exercises, consider this...Ch. 4.2 - For the following exercises, consider this...Ch. 4.2 - For the following exercises, consider this...Ch. 4.2 - For the following exercises, consider this...Ch. 4.2 - For the following exercises, use the graph in...Ch. 4.2 - For the following exercises, use the graph in...Ch. 4.2 - For the following exercises, use the graph in...Ch. 4.2 - For the following exercises, use the graph in...Ch. 4.2 - For the following exercises, use the graph in...Ch. 4.2 - For the following exercises, use the graph in...Ch. 4.2 - For the following exercises, use the graph in...Ch. 4.2 - For the following exercises, use the graph in...Ch. 4.2 - For the following exercises, use the median home...Ch. 4.2 - For the following exercises, use the median home...Ch. 4.2 - NUMERIC For the following exercises, use the...Ch. 4.2 - For the following exercises, use the median home...Ch. 4.2 - For the following exercises, use the median home...Ch. 4.2 - For the following exercises, use the median home...Ch. 4.2 - In 2004, a school population was 1,001. By 2008the...Ch. 4.2 - In 2003, a town’s population was 1,431. By 2007the...Ch. 4.2 - A phone company has a monthly cellular plan where...Ch. 4.2 - A phone company has a monthly cellular data plan...Ch. 4.2 - In 1991, the moose population in a park...Ch. 4.2 - In 2003, the owl population in a park was measured...Ch. 4.2 - The Federal Helium Reserve held about 16...Ch. 4.2 - Suppose the world’s oil reserves in 2014 are 1,820...Ch. 4.2 - You are choosing between two different prepaid...Ch. 4.2 - You are choosing between two different...Ch. 4.2 - When hired at a new job selling jewelry, you...Ch. 4.2 - When hired at a new job selling electronics, you...Ch. 4.2 - When hired at a new job selling electronics, you...Ch. 4.2 - When hired at a new job selling electronics, you...Ch. 4.3 - According to the data from Table 1, what...Ch. 4.3 - Use the model we created using technology in...Ch. 4.3 - Describe what it means if there is a model...Ch. 4.3 - What is interpolation when using a linear model?Ch. 4.3 - What is extrapolation when using a linear model?Ch. 4.3 - Explain the difference between a positive and...Ch. 4.3 - Explain how to interpret the absolute value of...Ch. 4.3 - A regression was run to determine whether there...Ch. 4.3 - A regression was run to determine whether there is...Ch. 4.3 - For the following exercises, draw a scatter plot...Ch. 4.3 - For the following exercises, draw a scatter plot...Ch. 4.3 - For the following exercises, draw a scatter plot...Ch. 4.3 - For the following exercises, draw a scatter plot...Ch. 4.3 - For the following exercises, draw a scatter plot...Ch. 4.3 - For the following exercises, draw a scatter plot...Ch. 4.3 - For the following exercises, match each...Ch. 4.3 - For the following exercises, match each...Ch. 4.3 - For the following exercises, match each...Ch. 4.3 - For the following exercises, match each...Ch. 4.3 - For the following exercises, draw a best-fit line...Ch. 4.3 - For the following exercises, draw a best-fit line...Ch. 4.3 - For the following exercises, draw a best-fit line...Ch. 4.3 - For the following exercises, draw a best-fit line...Ch. 4.3 - The U.S. Census tracks the percentage of persons...Ch. 4.3 - The US. import of wine (in hectoliters) for...Ch. 4.3 - Table 6 shows the year and the number ofpeople...Ch. 4.3 - For the following exercises, use each set of data...Ch. 4.3 - For the following exercises, use each set of data...Ch. 4.3 - For the following exercises, use each set of data...Ch. 4.3 - For the following exercises, use each set of data...Ch. 4.3 - For the following exercises, use each set of data...Ch. 4.3 - For the following exercises, use each set of data...Ch. 4.3 - For the following exercises, use each set of data...Ch. 4.3 - Graph f(x)=0.5x+10. Pick a set of 5 orderedpairs...Ch. 4.3 - Graph f(x)=2x10. Picka set of5 ordered pairs using...Ch. 4.3 - For the following exercises, consider this...Ch. 4.3 - For the following exercises, consider this...Ch. 4.3 - For the following exercises, consider this...Ch. 4.3 - For the following exercises, consider this...Ch. 4.3 - For the following exercises, consider this...Ch. 4.3 - For the following exercises, consider this...Ch. 4.3 - For the following exercises, consider this...Ch. 4.3 - For the following exercises, consider this...Ch. 4.3 - For the following exercises, consider this...Ch. 4 - Determine whether the algebraic equation is...Ch. 4 - Determine whether the algebraic equation is...Ch. 4 - Determine whether the function is increasing...Ch. 4 - Determine whether the function is increasing...Ch. 4 - Given each set of information, find a linear...Ch. 4 - Given each set of information, find a linear...Ch. 4 - Find the slope of the line shown in the graph.Ch. 4 - Find the slope of the line shown in the graph.Ch. 4 - Write an equation in slope-intercept form for the...Ch. 4 - Does the following table represent a linear...Ch. 4 - Does the following table represent a linear...Ch. 4 - On June 1st, a company has $4,000,000 profit.If...Ch. 4 - For the following exercises, determine whether the...Ch. 4 - For the following exercises, determine whether the...Ch. 4 - For the following exercises, find the x-and...Ch. 4 - For the following exercises, find the x-and...Ch. 4 - For the following exercises, use the descriptions...Ch. 4 - For the following exercises, use the descriptions...Ch. 4 - For the following exercises, use the descriptions...Ch. 4 - For the following exercises, use the descriptions...Ch. 4 - For the following exercises, use the descriptions...Ch. 4 - For the following exercises, use the descriptions...Ch. 4 - For the following exercises, use the descriptions...Ch. 4 - Find the area of a triangle bounded by the y-axis,...Ch. 4 - A town’s population increases at a constant rate....Ch. 4 - The number of people afflicted with the common...Ch. 4 - For the following exercises, use the graph in...Ch. 4 - For the following exercises, use the graph in...Ch. 4 - For the following exercise, consider this...Ch. 4 - For the following exercises, consider this...Ch. 4 - For the following exercises, consider this...Ch. 4 - For the following exercises, consider this...Ch. 4 - For the following exercises, consider this...Ch. 4 - Draw a scatter plot for the data in Table 2. Then...Ch. 4 - Draw a scatter plot for the data in Table 3. If we...Ch. 4 - Eight students were asked to estimate their score...Ch. 4 - Draw a best-fit line for the plotted data.Ch. 4 - For the following exercises, consider the data in...Ch. 4 - For the following exercises, consider the data in...Ch. 4 - For the following exercises, consider the data in...Ch. 4 - For the following exercises, consider the data in...Ch. 4 - For the following exercises, consider this...Ch. 4 - For the following exercises, consider this...Ch. 4 - For the following exercises, consider this...Ch. 4 - For the following exercises, consider this...Ch. 4 - Determine whether the following algebraic...Ch. 4 - Determine whether the following function...Ch. 4 - Determine whether the following function...Ch. 4 - Given the following set of information, find a...Ch. 4 - Given the following set of information. find a...Ch. 4 - Find the slope ofthe line in Figure l.Ch. 4 - Write an equation for line in Figure 2.Ch. 4 - Does Table 1 represent a linear function? If so,...Ch. 4 - Does Table 2 represent a linear function? If so,...Ch. 4 - At 6 am, an online company has sold 120 items that...Ch. 4 - For the following exercises, determine whether the...Ch. 4 - For the following exercises, determine whether the...Ch. 4 - For the following exercises, determine whether the...Ch. 4 - For the following exercises, determine whether the...Ch. 4 - For the following exercises, determine whether the...Ch. 4 - For the following exercises, determine whether the...Ch. 4 - For the following exercises, determine whether the...Ch. 4 - For the following exercises, determine whether the...Ch. 4 - For the following exercises, determine whether the...Ch. 4 - For the following exercises, determine whether the...Ch. 4 - For the following exercises, determine whether the...Ch. 4 - For the following exercises, determine whether the...Ch. 4 - For the following exercises, use the graph in...Ch. 4 - For the following exercises, use the graph in...Ch. 4 - For the following exercises, use the graph in...Ch. 4 - For the following exercises, use the graph in...Ch. 4 - For the following exercises, use the graph in...Ch. 4 - For the following exercises, use Table 4 which...Ch. 4 - For the following exercises, use Table 4 which...Ch. 4 - For the following exercises, use Table 4 which...Ch. 4 - For the following exercises, consider this...Ch. 4 - For the following exercises, consider this...Ch. 4 - For the following exercises, consider this...
Additional Math Textbook Solutions
Find more solutions based on key concepts
Calculate possible sides of right angle triangle.
Pre-Algebra Student Edition
CHECK POINT I Express as a percent.
Thinking Mathematically (6th Edition)
A pair of fair dice is rolled. What is the probability that the second die lands on a higher value than does th...
A First Course in Probability (10th Edition)
Determining Sample Size. In Exercises 31–38, use the given data to find the minimum sample size required to est...
Elementary Statistics (13th Edition)
Explain the meaning of the term “statistically significant difference” in statistics terminology.
Intro Stats, Books a la Carte Edition (5th Edition)
Fill in each blank so that the resulting statement is true. The quadratic function f(x)=a(xh)2+k,a0, is in ____...
Algebra and Trigonometry (6th Edition)
Knowledge Booster


Learn more about
Need a deep-dive on the concept behind this application? Look no further. Learn more about this topic, algebra and related others by exploring similar questions and additional content below.Similar questions
- Given the following system of equations and its graph below, what can be determined about the slopes and y-intercepts of the system of equations? 7 y 6 5 4 3 2 -6-5-4-3-2-1 1+ -2 1 2 3 4 5 6 x + 2y = 8 2x + 4y = 12 The slopes are different, and the y-intercepts are different. The slopes are different, and the y-intercepts are the same. The slopes are the same, and the y-intercepts are different. O The slopes are the same, and the y-intercepts are the same.arrow_forwardChoose the function to match the graph. -2- 0 -7 -8 -9 --10- |--11- -12- f(x) = log x + 5 f(x) = log x - 5 f(x) = log (x+5) f(x) = log (x-5) 9 10 11 12 13 14arrow_forwardWhich of the following represents the graph of f(x)=3x-2? 7 6 5 4 ++ + + -7-6-5-4-3-2-1 1 2 3 4 5 6 7 -2 3 -5 6 -7 96 7 5 4 O++ -7-6-5-4-3-2-1 -2 -3 -4 -5 -7 765 432 -7-6-5-4-3-2-1 -2 ++ -3 -4 -5 -6 2 3 4 5 6 7 7 6 2 345 67 -7-6-5-4-3-2-1 2 3 4 5 67 4 -5arrow_forward
- 13) Let U = {j, k, l, m, n, o, p} be the universal set. Let V = {m, o,p), W = {l,o, k}, and X = {j,k). List the elements of the following sets and the cardinal number of each set. a) W° and n(W) b) (VUW) and n((V U W)') c) VUWUX and n(V U W UX) d) vnWnX and n(V WnX)arrow_forward9) Use the Venn Diagram given below to determine the number elements in each of the following sets. a) n(A). b) n(A° UBC). U B oh a k gy ท W z r e t ་ Carrow_forward10) Find n(K) given that n(T) = 7,n(KT) = 5,n(KUT) = 13.arrow_forward
- 7) Use the Venn Diagram below to determine the sets A, B, and U. A = B = U = Blue Orange white Yellow Black Pink Purple green Grey brown Uarrow_forward8) Use the Venn diagram provided to shade An Bº. A B U Darrow_forward5) Describe the difference between disjoint sets and overlapping sets.arrow_forward
arrow_back_ios
SEE MORE QUESTIONS
arrow_forward_ios
Recommended textbooks for you

 Glencoe Algebra 1, Student Edition, 9780079039897...AlgebraISBN:9780079039897Author:CarterPublisher:McGraw Hill
 Trigonometry (MindTap Course List)TrigonometryISBN:9781337278461Author:Ron LarsonPublisher:Cengage Learning
 Functions and Change: A Modeling Approach to Coll...AlgebraISBN:9781337111348Author:Bruce Crauder, Benny Evans, Alan NoellPublisher:Cengage Learning
 Algebra & Trigonometry with Analytic GeometryAlgebraISBN:9781133382119Author:SwokowskiPublisher:Cengage
Glencoe Algebra 1, Student Edition, 9780079039897...
Algebra
ISBN:9780079039897
Author:Carter
Publisher:McGraw Hill
Trigonometry (MindTap Course List)
Trigonometry
ISBN:9781337278461
Author:Ron Larson
Publisher:Cengage Learning
Functions and Change: A Modeling Approach to Coll...
Algebra
ISBN:9781337111348
Author:Bruce Crauder, Benny Evans, Alan Noell
Publisher:Cengage Learning
Algebra & Trigonometry with Analytic Geometry
Algebra
ISBN:9781133382119
Author:Swokowski
Publisher:Cengage
Inverse Functions; Author: Professor Dave Explains;https://www.youtube.com/watch?v=9fJsrnE1go0;License: Standard YouTube License, CC-BY