For the following exercises, use the graph in Figure 3, showing the profit, y , in thousands of dollars, of a company in a given year, x , where x represents years since 1980. In 2004, a school population was 1250. By 2012 the population had dropped to 875. Assume the population is changing linearly. a. How much did the population drop between the year 2004 and 2012? b. What is the average population decline per year? c. Find an equation for the population, P , of the school t years after 2004.
For the following exercises, use the graph in Figure 3, showing the profit, y , in thousands of dollars, of a company in a given year, x , where x represents years since 1980. In 2004, a school population was 1250. By 2012 the population had dropped to 875. Assume the population is changing linearly. a. How much did the population drop between the year 2004 and 2012? b. What is the average population decline per year? c. Find an equation for the population, P , of the school t years after 2004.
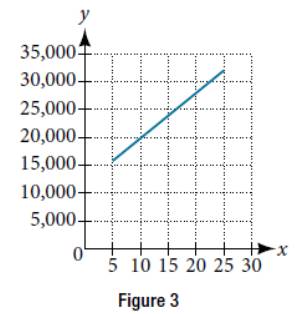
For the following exercises, use the graph in Figure 3, showing the profit, y, in thousands of dollars, of a company in a given year, x, where x represents years since 1980.
In 2004, a school population was 1250. By 2012 the population had dropped to 875. Assume the population is changing linearly.
a. How much did the population drop between the year 2004 and 2012?
b. What is the average population decline per year?
c. Find an equation for the population, P, of the school t years after 2004.
Write the equation of the trigonometric
function shown in the graph.
LO
5
4
3
2
1
y
-5
-5
4
8
8
500
-1
-2
-3
-4
-5
x
5
15л
5л
25л
15л
35π
5л
4
8
2
8
4
8
2. If log2 (sin x) + log₂ (cos x) = -2 and log2 (sin x + cos x) = (-2 + log2 n), find n.
Need a deep-dive on the concept behind this application? Look no further. Learn more about this topic, algebra and related others by exploring similar questions and additional content below.
Linear Equation | Solving Linear Equations | What is Linear Equation in one variable ?; Author: Najam Academy;https://www.youtube.com/watch?v=tHm3X_Ta_iE;License: Standard YouTube License, CC-BY


 Trigonometry (MindTap Course List)TrigonometryISBN:9781337278461Author:Ron LarsonPublisher:Cengage Learning
 Glencoe Algebra 1, Student Edition, 9780079039897...AlgebraISBN:9780079039897Author:CarterPublisher:McGraw Hill

 College AlgebraAlgebraISBN:9781305115545Author:James Stewart, Lothar Redlin, Saleem WatsonPublisher:Cengage Learning
 Algebra: Structure And Method, Book 1AlgebraISBN:9780395977224Author:Richard G. Brown, Mary P. Dolciani, Robert H. Sorgenfrey, William L. ColePublisher:McDougal Littell