Concept explainers
(a):
The equilibrium
(a):
Explanation of Solution
The equilibrium demand and supply of milk in the economy can be obtained at the point of intersection of the market demand and supply curves in the economy. The market demand and supply schedules are given, and a graph can be plotted on the basis of the schedule as follows:
|
Quantity demanded (millions of gallons) |
Quantity supplied (millions of gallons) | |
| $10.00 | 100 | 500 |
| 8.00 | 200 | 400 |
| 6.00 | 300 | 300 |
| 4.00 | 400 | 200 |
| 2.00 | 500 | 100 |
Based on this table, it is identified that the quantity supplied increases as price increases and there is a direct and positive relation between the price and quantity supplied. On the other hand, there is a negative relation between the quantity demanded and price because the quantity demanded decreases as price increases. Thus, the quantity demanded will be indicated by a downward sloping curve, whereas the quantity supplied will be indicated by an upward sloping curve as follows:
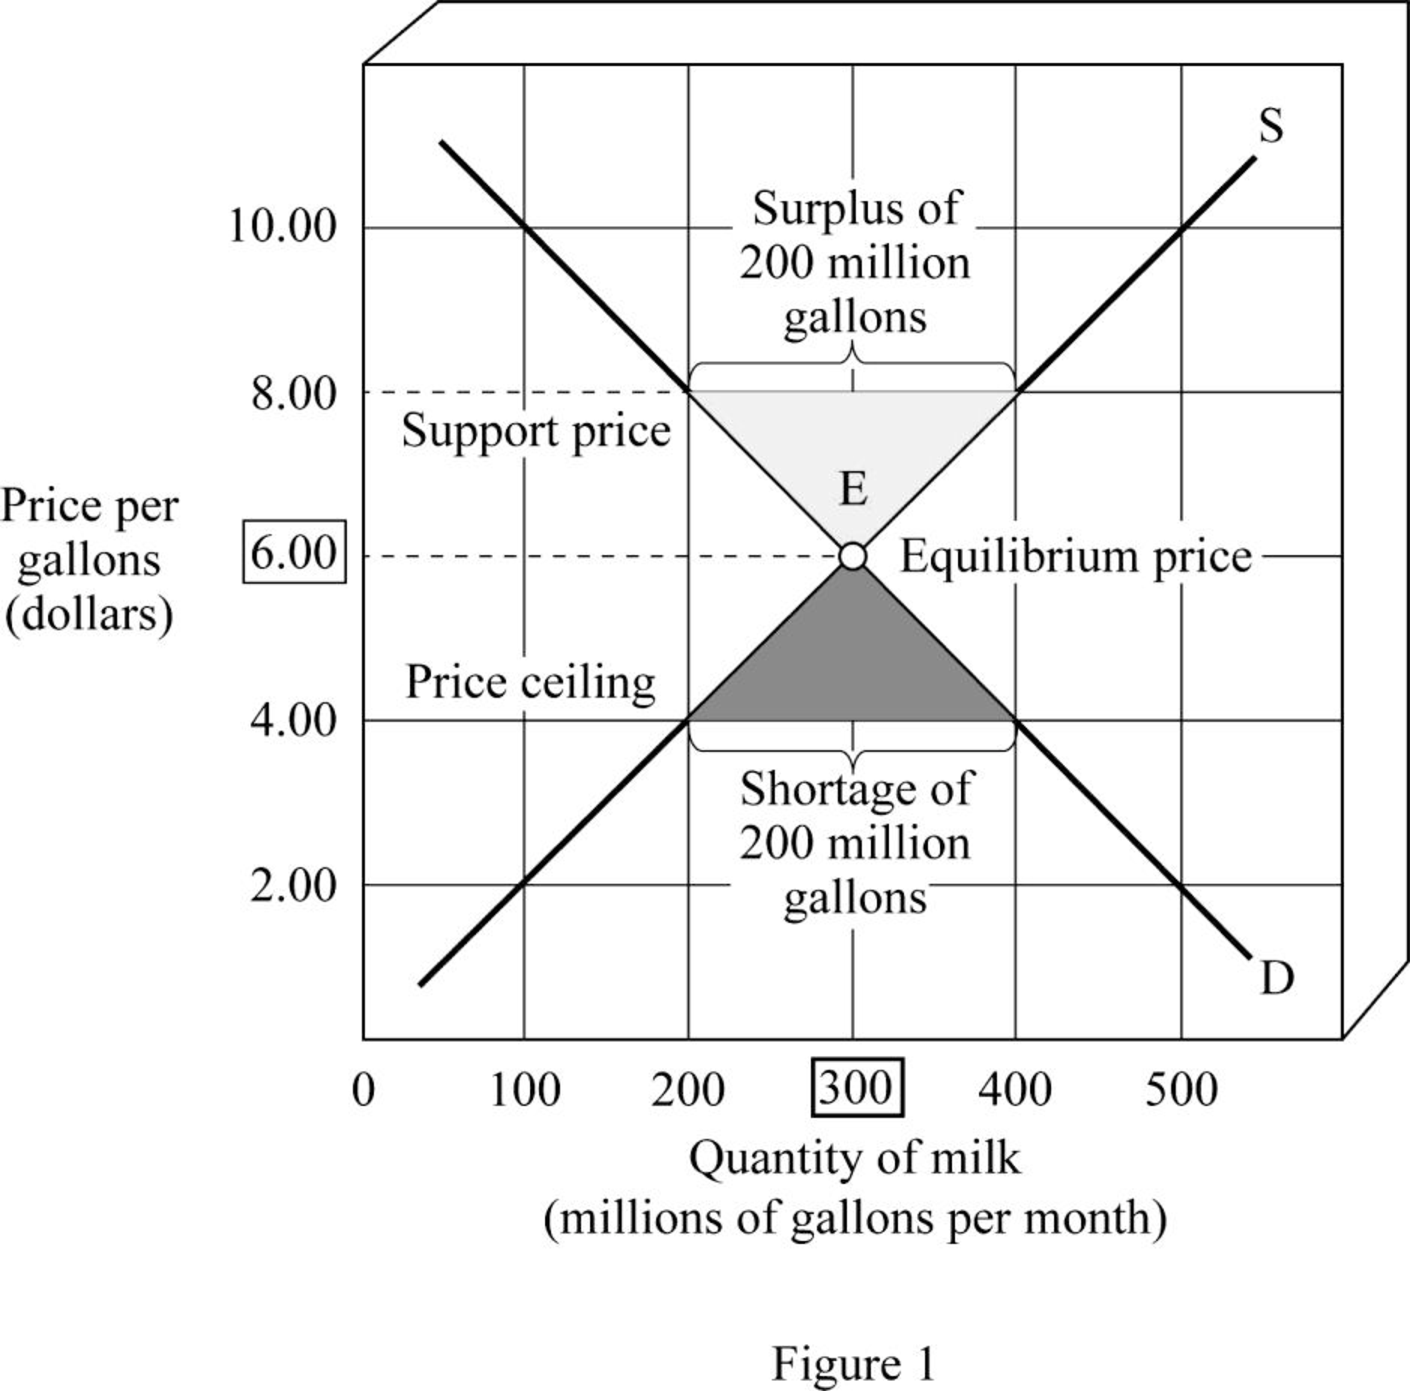
From the diagram, it is observed that the market demand for milk and the supply of milk intersect at Point E. The corresponding quantity at Point E will be the
Equilibrium: Equilibrium in the market is obtained at the point where the market demand is equal to the market supply, and there is no excess demand or supply present in the economy.
(b):
The effect of support price of $8 per gallon of milk.
(b):
Explanation of Solution
From the diagram, it is observed that the market demand for milk and the supply of milk intersect at Point E. The corresponding quantity Point E will be the equilibrium quantity of milk and the corresponding price Point E will be the equilibrium price of the milk. Thus, at the point of equilibrium E, the equilibrium price is $6 per gallon and the quantity is 300 gallons per month.
However, when the government enacts the support price of $8 per gallon, the market price will be $8 per gallon. The quantity demanded at this price is 200 gallons per month, whereas the quantity supplied is 400 gallons per month. This means that there will be a surplus of 200 gallons of milk in the economy. The government has to purchase this excess surplus from the market. Since the government revenue is the tax revenue, the non–milk-drinking taxpayers have to pay for the milk indirectly.
(c):
The effect of ceiling price of $4 per gallon of milk.
(c):
Explanation of Solution
When the government enacts the ceiling price of $4 per gallon, the market price will be $4 per gallon. The quantity demanded at this price is 400 gallons per month, whereas the quantity supplied is 200 gallons per month. This means that there will be a shortage of 200 gallons of milk in the economy. The government has to ration the milk in order to prevent the black marketing of milk. This is caused due to the action of the government to keep the price of milk below the equilibrium level of $6 per gallon.
Want to see more full solutions like this?
Chapter 4 Solutions
Economics For Today


- Q1. (Chap 1: Game Theory.) In the simultaneous games below player 1 is choosing between Top and Bottom, while player 2 is choosing between Left and Right. In each cell the first number is the payoff to player 1 and the second is the payoff to player 2. Part A: Player 1 Top Bottom Player 2 Left 25, 22 Right 27,23 26,21 28, 22 (A1) Does player 1 have a dominant strategy? (Yes/No) If your answer is yes, which one is it? (Top/Bottom) (A2) Does player 2 have a dominant strategy? (Yes/No.) If your answer is yes, which one is it? (Left/Right.) (A3) Can you solve this game by using the dominant strategy method? (Yes/No) If your answer is yes, what is the solution?arrow_forwardnot use ai pleasearrow_forwardsubject to X1 X2 Maximize dollars of interest earned = 0.07X1+0.11X2+0.19X3+0.15X4 ≤ 1,000,000 <2,500,000 X3 ≤ 1,500,000 X4 ≤ 1,800,000 X3 + XA ≥ 0.55 (X1+X2+X3+X4) X1 ≥ 0.15 (X1+X2+X3+X4) X1 + X2 X3 + XA < 5,000,000 X1, X2, X3, X4 ≥ 0arrow_forward
- Unit VI Assignment Instructions: This assignment has two parts. Answer the questions using the charts. Part 1: Firm 1 High Price Low Price High Price 8,8 0,10 Firm 2 Low Price 10,0 3,3 Question: For the above game, identify the Nash Equilibrium. Does Firm 1 have a dominant strategy? If so, what is it? Does Firm 2 have a dominant strategy? If so, what is it? Your response:arrow_forwardnot use ai please don't kdjdkdkfjnxncjcarrow_forwardAsk one question at a time. Keep questions specific and include all details. Need more help? Subject matter experts with PhDs and Masters are standing by 24/7 to answer your question.**arrow_forward
- 1b. (5 pts) Under the 1990 Farm Bill and given the initial situation of a target price and marketing loan, indicate where the market price (MP), quantity supplied (QS) and demanded (QD), government stocks (GS), and Deficiency Payments (DP) and Marketing Loan Gains (MLG), if any, would be on the graph below. If applicable, indicate the price floor (PF) on the graph. TP $ NLR So Do Q/yrarrow_forwardNow, let us assume that Brie has altruistic preferences. Her utility function is now given by: 1 UB (xA, YA, TB,YB) = (1/2) (2x+2y) + (2x+2y) What would her utility be at the endowment now? (Round off your answer to the nearest whole number.) 110arrow_forwardProblema 4 (20 puntos): Supongamos que tenemos un ingreso de $120 y enfrentamos los precios P₁ =6 y P₂ =4. Nuestra función de utilidad es: U(x1, x2) = x0.4x0.6 a) Planteen el problema de optimización y obtengan las condiciones de primer orden. b) Encuentren el consumo óptimo de x1 y x2. c) ¿Cómo cambiará nuestra elección óptima si el ingreso aumenta a $180?arrow_forward


 Economics (MindTap Course List)EconomicsISBN:9781337617383Author:Roger A. ArnoldPublisher:Cengage Learning

 Exploring EconomicsEconomicsISBN:9781544336329Author:Robert L. SextonPublisher:SAGE Publications, Inc