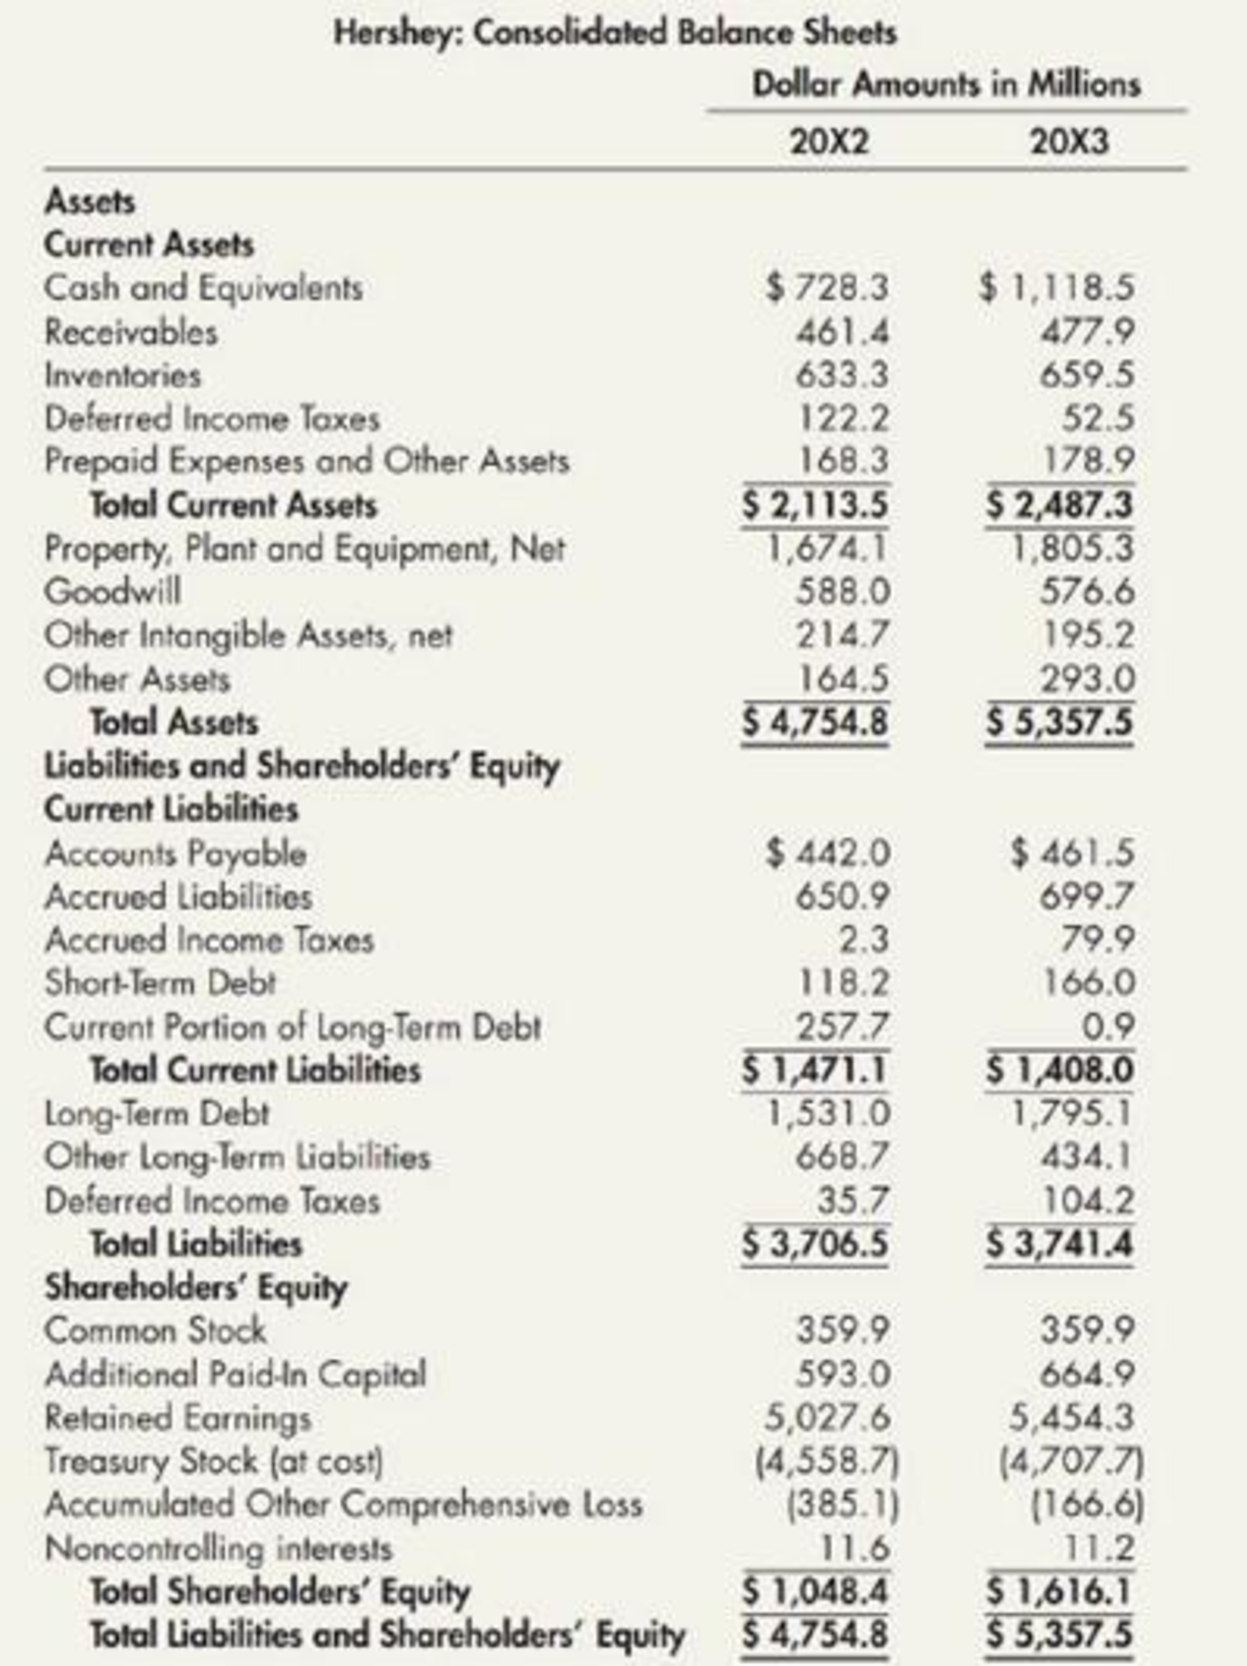
Use the following information for P4—17 and P4—18:
The Hershey Company is one of the world’s leading producers of chocolates, candies, and confections. It sells chocolates and candies, mints and gums, baking ingredients, toppings, and beverages. Hershey’s consolidated

Ratios Analysis: Hershey Refer to the information for Hershey On the preceding page. Additional information for 20X3 is as follows (amounts in millions):

Required:
Next Level Compute the following ratios for 20X3. Provide a brief description of what each ratio reveals about Hershey.
- 1. return on common equity
- 2. debt-to-assets
- 3. debt-to-equity
- 4. current
- 5. quick (Hershey uses cash and equivalents, short terms securities, and receivables in their quick ratio calculation.)
- 6. inventory turnover days
- 7.
accounts receivable turnover days - 8. accounts payable turnover days
- 9. operating cycle (in days)
- 10. total asset turnover
Requirement 1:
Determine the return on common equity ratio of Company H for 20X3.
Explanation of Solution
Determine the return on common equity ratio of Company H for 20X3:
Step 1: Calculate the average total common stockholders’ equity.
Step 2: Calculate the return on common equity ratio of C&C Incorporation for 20X3.
Hence, the return on common equity ratio of Company H for 20X3 is 0.616.
Comment:
Return on common equity ratio indicates that Company H generated a 61.6% return for its common shareholders.
Requirement 2:
Determine the debt-to-assets ratio of Company H for 20X3.
Explanation of Solution
Determine the debt-to-assets ratio of Company H for 20X3:
Hence, the debt-to-assets ratio of Company H for 20X3 is 0.698.
Comment:
Debt-to-assets ratio indicates that Company H’s 69.8% of total assets are financed by its creditors.
Requirement 3:
Determine the debt-to-equity ratio of Company H for 20X3.
Explanation of Solution
Determine the debt-to-equity ratio of Company H for 20X3:
Hence, the debt-to- equity ratio of Company H for 20X3 is 2.32.
Comment:
Debt-to-assets ratio indicates that Company H has $2.32 in total liabilities for every of $1.00 in equity.
Requirement 4:
Determine the current ratio of Company H for 20X3.
Explanation of Solution
Determine the current ratio of Company H for 20X3:
Hence, the current ratio of Company H for 20X3 is 1.77.
Comment:
Current ratio indicates that Company H has $1.77 in current assets for every of $1.00 in current liabilities.
Requirement 5:
Determine the quick ratio of Company H for 20X3.
Explanation of Solution
Determine the quick ratio of Company H for 20X3:
Hence, the quick ratio of Company H for 20X3 is 1.13.
Comment:
Quick ratio indicates that Company H has $1.13 in quick assets (cash and receivables) for every of $1.00 in current liabilities.
Requirement 6:
Determine the inventory turnover in days of Company H for 20X3.
Explanation of Solution
Determine the inventory turnover in days of Company H for 20X3:
Step 1: Calculate the average inventory.
Step 2: Calculate the inventory turnover.
Step 3: Calculate the inventory turnover in days of C&C Incorporation for 20X3.
Hence, the inventory turnover days of Company H for 20X3 are 61 days.
Comment:
On an average Company H takes 61 days to convert inventory into sales in the operation cycle.
Requirement 7:
Determine the accounts receivable turnover in days of Company H for 20X3.
Explanation of Solution
Determine the accounts receivable turnover in days of Company H for 20X3:
Step 1: Calculate the average accounts receivable.
Step 2: Calculate the accounts receivable turnover.
Step 3: Calculate the accounts receivable turnover in days of C&C Incorporation for 20X3.
Hence, the accounts receivable turnover days of Company H for 20X3 are 24 days.
Comment:
On an average Company H takes 24 days to collect its receivables from its customers.
Requirement 8:
Determine the accounts payable turnover in days of Company H for 20X3.
Explanation of Solution
Determine the accounts payable turnover in days of Company H for 20X3.
Step 1: Determine the amount of inventory purchases.
Step 2: Calculate the average accounts payable.
Step 3: Calculate the accounts payable turnover.
Step 4: Determine the accounts payable turnover in days.
Hence, the accounts payable turnover in days of Company H for 20X3 is 42 days.
Comment:
On an average Company H takes 42 days to pay its payables to its suppliers.
Requirement 9:
Determine the operating cycle in days of Company H for 20X3.
Explanation of Solution
Determine the operating cycle in days of Company H for 20X3:
Hence, the operating cycle in days of Company H for 20X3 is 43 days.
Comment:
Company H takes 43days to complete an operating cycle (the purchase of inventory and collection of cash from accounts receivable).
Requirement 10:
Determine the total assets turnover ratio of Company H for 20X3.
Explanation of Solution
Determine the total assets turnover ratio of Company H for 20X3:
Step 1: Calculate average total assets.
Step 2: Calculate the total assets turnover ratio of C&C Incorporation for 20X3.
Hence, the total assets turnover ratio of Company H for 20X3 is 1.41.
Comment:
Total assets turnover ratio indicates that Company H has generated $1.41 in sales for every of $1.00 in assets
Want to see more full solutions like this?
Chapter 4 Solutions
Intermediate Accounting: Reporting and Analysis (Looseleaf)
- For each of the transactions above, indicate the amount of the adjusting entry on the elements of the balance sheet and income statement.Note: Enter negative amounts with a minus sign.arrow_forwardNeed help with this question solution general accountingarrow_forwardDon't use ai given answer accounting questionsarrow_forward
- I want to correct answer general accounting questionarrow_forwardKindly help me with accounting questionsarrow_forwardDuo Corporation is evaluating a project with the following cash flows: Year 0 1 2 3 Cash Flow -$ 30,000 12,200 14,900 16,800 4 5 13,900 -10,400 The company uses an interest rate of 8 percent on all of its projects. a. Calculate the MIRR of the project using the discounting approach. Note: Do not round intermediate calculations and enter your answer as a percent rounded to 2 decimal places, e.g., 32.16. b. Calculate the MIRR of the project using the reinvestment approach. Note: Do not round intermediate calculations and enter your answer as a percent rounded to 2 decimal places, e.g., 32.16. c. Calculate the MIRR of the project using the combination approach. Note: Do not round intermediate calculations and enter your answer as a percent rounded to 2 decimal places, e.g., 32.16. a. Discounting approach MIRR b. Reinvestment approach MIRR c. Combination approach MIRR % % %arrow_forward
- Provide correct answer general accounting questionarrow_forwardNeed help with this question solution general accountingarrow_forwardConsider a four-year project with the following information: Initial fixed asset investment = $555,000; straight-line depreciation to zero over the four-year life; zero salvage value; price = $37; variable costs = $25; fixed costs = $230,000; quantity sold = 79,000 units; tax rate = 24 percent. How sensitive is OCF to changes in quantity sold?arrow_forward
 Intermediate Accounting: Reporting And AnalysisAccountingISBN:9781337788281Author:James M. Wahlen, Jefferson P. Jones, Donald PagachPublisher:Cengage Learning
 Managerial Accounting: The Cornerstone of Busines...AccountingISBN:9781337115773Author:Maryanne M. Mowen, Don R. Hansen, Dan L. HeitgerPublisher:Cengage Learning
 Managerial AccountingAccountingISBN:9781337912020Author:Carl Warren, Ph.d. Cma William B. TaylerPublisher:South-Western College Pub
 Financial AccountingAccountingISBN:9781337272124Author:Carl Warren, James M. Reeve, Jonathan DuchacPublisher:Cengage Learning
 Intermediate Financial Management (MindTap Course...FinanceISBN:9781337395083Author:Eugene F. Brigham, Phillip R. DavesPublisher:Cengage Learning


