
Videos
For its first 2 decades of existence, the NBA’s Orlando Magic basketball team set seat prices for its 41-game home
But when Anthony Perez, director of business strategy, finished his MBA at the University of Florida, he developed a valuable database of ticket sales. Analysis of the data led him to build a
Studying individual sales of Magic tickets on the open Stub Hub marketplace during the prior season, Perez determined the additional potential sales revenue the Magic could have made had they charged prices the fans had proven they were willing to pay on Stub Hub. This became his dependent variable, y, in a multiple-regression model.
He also found that three variables would help him build the “true market” seat price for every game. With his model, it was possible that the same seat in the arena would have as many as seven different prices created at season onset—sometimes higher than expected on average and sometimes lower.
The major factors he found to be statistically significant in determining how high the demand for a game ticket, and hence, its price, would be were:
► The day of the week (x1)
► A rating of how popular the opponent was (x2)
► The time of the year (x3)
For the day of the week, Perez found that Mondays were the least-favored game days (and he assigned them a value of 1). The rest of the weekdays increased in popularity, up to a Saturday game, which he rated a 6. Sundays and Fridays received 5 ratings, and holidays a 3 (refer to the footnote in Table 4.2).

Fernado Medina
TABLE 4.2 Data for Last Year’s Magic Ticket Sales Pricing Model
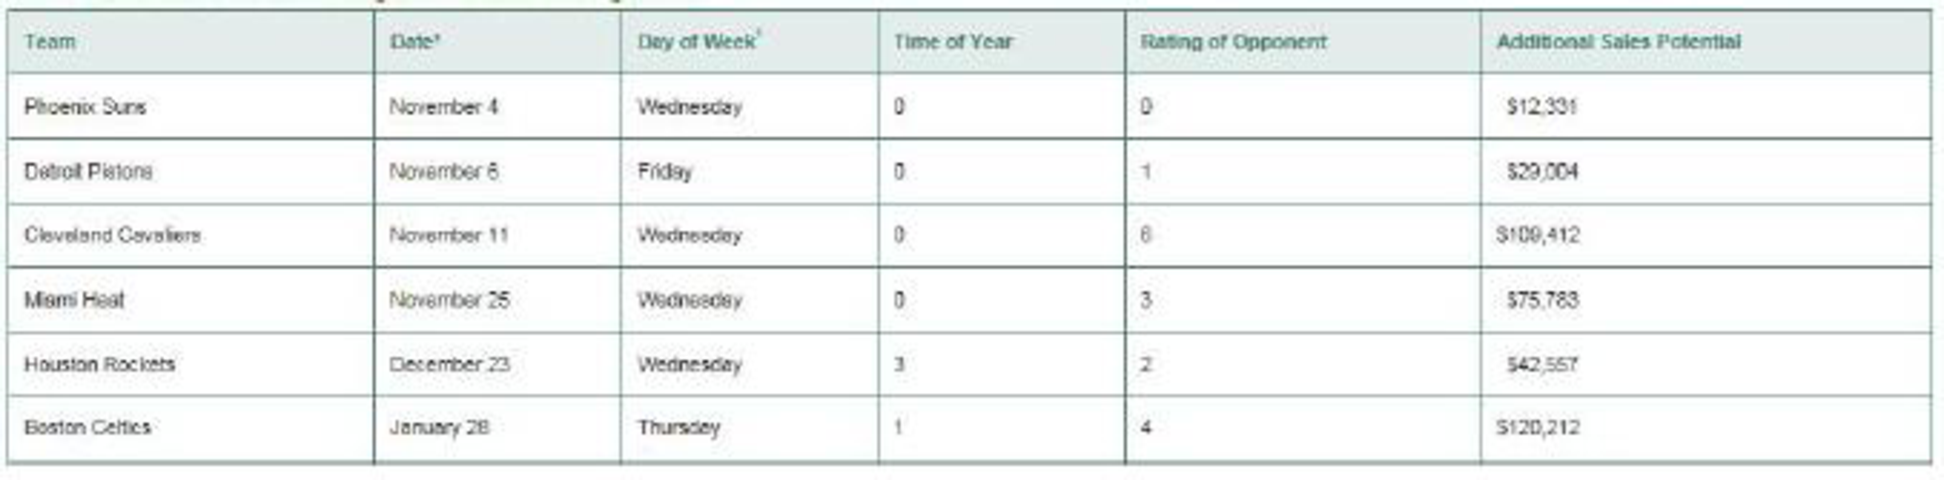
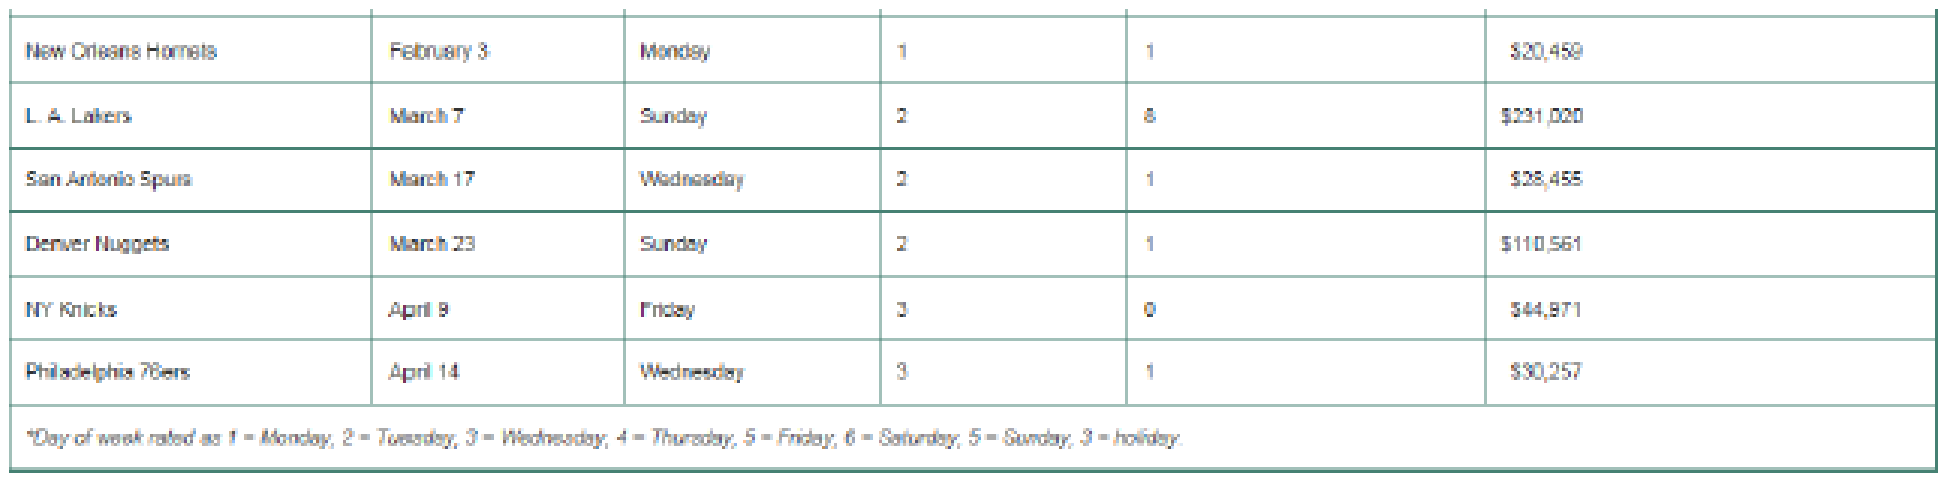
His ratings of opponents, done just before the start of the season, were subjective and range from a low of 0 to a high of 8. A very high-rated team in that particular season may have had one or more superstars on its roster, or have won the NBA finals the prior season, making it a popular fan draw.
Finally, Perez believed that the NBA season could be divided into four periods in popularity:
► Early games (which he assigned 0 scores)
► Games during the Christmas season (assigned a 3)
► Games until the All-Star break (given a 2)
► Games leading into the play-offs (scored with a 3)
The first year Perez built his multiple-regression model, the dependent variable y, which was a “potential premium revenue score,” yielded an R2 =.86 with this equation:
Table 4.2 illustrates, for brevity in this case study, a sample of 12 games that year (out of the total 41 home game regular season), including the potential extra revenue per game (y) to be expected using the variable pricing model.
A leader in NBA variable pricing, the Orlando Magic have learned that regression analysis is indeed a profitable forecasting tool.
1. Use the data in Table 4.2 to build a regression model with day of the week as the only independent variable.
3. Using Perez’s multiple-regression model, what would be the additional sales potential of a Thursday Miami Heat game played during the Christmas holiday?
Want to see the full answer?
Check out a sample textbook solution
Chapter 4 Solutions
OPEARATIONS MANAG.REV CUSTOM 2017


- Can you guys help me with this? Thank you! Here's the question: Compared to the CONSTRAINT model, how has the network changed? How do you plan to add contingency to your network? Please answer this throughly Here's the what-if scenario: Assume that Dallas plant has lost power. It cannot serve the DCs anymore and has to remain locked indefinitely. Re-optimize the network considering this new constraint. Here's the scenario comparison analysis: Scenario Constraint Scenario vs What-if Scenario Summary In comparing the Constraint Scenario to the What-if Scenario, a few key differences highlight the efficiencies evident in the supply chain. Firstly, the total cost in the Constraint Scenario is lower at $7,424,575.45, while the What-if Scenario incurs a total cost of $7,486,369.12, resulting in a cost delta of $61,793.67. Additionally, although both scenarios exhibit the same average service time of 0.72 days, the What-if Scenario has a more favorable average end-to-end service time of 2.41…arrow_forwardEmployee In-Service Training ASSIGNMENT: In-Service Training. The intern is required to plan and implement two in-service training sessions for employees. Each in-service should last at least 10 but not more than 30 minutes and should be given to all employees affected. The preceptor or supervisor/unit manager must approve all in-service topics. 1) One presentation should be related to a policy or procedure of any kind (e.g. proper use of equipment); 2) The second presentation must be related to sanitation or safety. For each in-service presentation, the intern must develop a written class plan and a visual aid (may be a handout, poster, PowerPoint slide presentation, etc.) appropriate to the life experiences, cultural diversity and educational background of the target audience. The intern must also measure behavior change. Note, this cannot be measured by a written pre- and post- test. That would be measuring knowledge. The intern mustactually observe and document that the learners…arrow_forwardFor a dietary manager in a nursing home to train a dietary aidearrow_forward
- Dietary Management in a Nursing Home. As detailed as possible.arrow_forwardFor dietary management in a nursing home. As detailed as possible.arrow_forwardA small furniture manufacturer produces tables and chairs. Each product must go through three stages of the manufacturing process – assembly, finishing, and inspection. Each table requires 3 hours of assembly, 2 hours of finishing, and 1 hour of inspection. The profit per table is $120 while the profit per chair is $80. Currently, each week there are 200 hours of assembly time available, 180 hours of finishing time, and 40 hours of inspection time. Linear programming is to be used to develop a production schedule. Define the variables as follows: T = number of tables produced each week C= number of chairs produced each week According to the above information, what would the objective function be? (a) Maximize T+C (b) Maximize 120T + 80C (c) Maximize 200T+200C (d) Minimize 6T+5C (e) none of the above According to the information provided in Question 17, which of the following would be a necessary constraint in the problem? (a) T+C ≤ 40 (b) T+C ≤ 200 (c) T+C ≤ 180 (d) 120T+80C ≥ 1000…arrow_forward
- As much detail as possible. Dietary Management- Nursing Home Don't add any fill-in-the-blanksarrow_forwardMenu Planning Instructions Use the following questions and points as a guide to completing this assignment. The report should be typed. Give a copy to the facility preceptor. Submit a copy in your Foodservice System Management weekly submission. 1. Are there any federal regulations and state statutes or rules with which they must comply? Ask preceptor about regulations that could prescribe a certain amount of food that must be kept on hand for emergencies, etc. Is the facility accredited by any agency such as Joint Commission? 2. Describe the kind of menu the facility uses (may include standard select menu, menu specific to station, non-select, select, room service, etc.) 3. What type of foodservice does the facility have? This could be various stations to choose from, self-serve, 4. conventional, cook-chill, assembly-serve, etc. Are there things about the facility or system that place a constraint on the menu to be served? Consider how patients/guests are served (e.g. do they serve…arrow_forwardWork with the chef and/or production manager to identify a menu item (or potential menu item) for which a standardized recipe is needed. Record the recipe with which you started and expand it to meet the number of servings required by the facility. Develop an evaluation rubric. Conduct an evaluation of the product. There should be three or more people evaluating the product for quality. Write a brief report of this activity • Product chosen and the reason why it was selected When and where the facility could use the product The standardized recipe sheet or card 。 o Use the facility's format or Design one of your own using a form of your choice; be sure to include the required elements • • Recipe title Yield and portion size Cooking time and temperature Ingredients and quantities Specify AP or EP Procedures (direction)arrow_forward
 Purchasing and Supply Chain ManagementOperations ManagementISBN:9781285869681Author:Robert M. Monczka, Robert B. Handfield, Larry C. Giunipero, James L. PattersonPublisher:Cengage Learning
 Practical Management ScienceOperations ManagementISBN:9781337406659Author:WINSTON, Wayne L.Publisher:Cengage,