Videos
For its first 2 decades of existence, the NBA’s Orlando Magic basketball team set seat prices for its 41-game home
But when Anthony Perez, director of business strategy, finished his MBA at the University of Florida, he developed a valuable database of ticket sales. Analysis of the data led him to build a
Studying individual sales of Magic tickets on the open Stub Hub marketplace during the prior season, Perez determined the additional potential sales revenue the Magic could have made had they charged prices the fans had proven they were willing to pay on Stub Hub. This became his dependent variable, y, in a multiple-regression model.
He also found that three variables would help him build the “true market” seat price for every game. With his model, it was possible that the same seat in the arena would have as many as seven different prices created at season onset—sometimes higher than expected on average and sometimes lower.
The major factors he found to be statistically significant in determining how high the demand for a game ticket, and hence, its price, would be were:
► The day of the week (x1)
► A rating of how popular the opponent was (x2)
► The time of the year (x3)
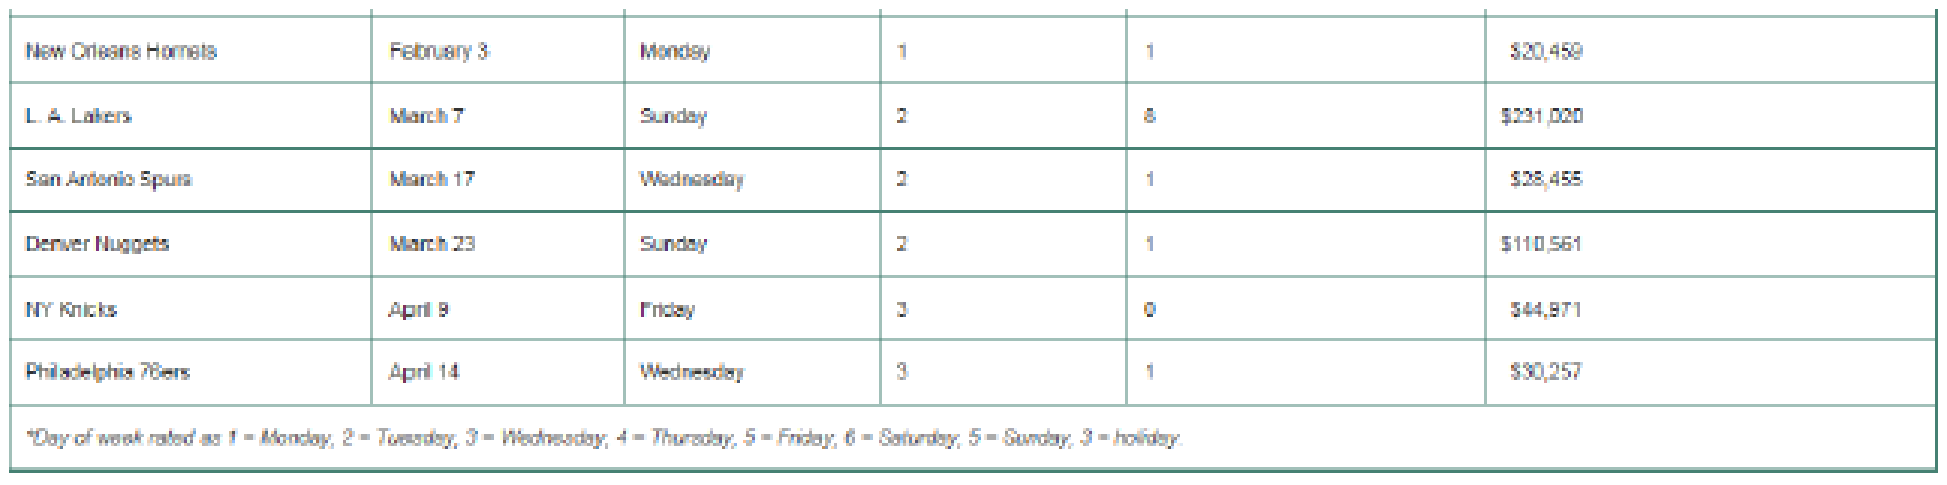
For the day of the week, Perez found that Mondays were the least-favored game days (and he assigned them a value of 1). The rest of the weekdays increased in popularity, up to a Saturday game, which he rated a 6. Sundays and Fridays received 5 ratings, and holidays a 3 (refer to the footnote in Table 4.2).

Fernado Medina
TABLE 4.2 Data for Last Year’s Magic Ticket Sales Pricing Model
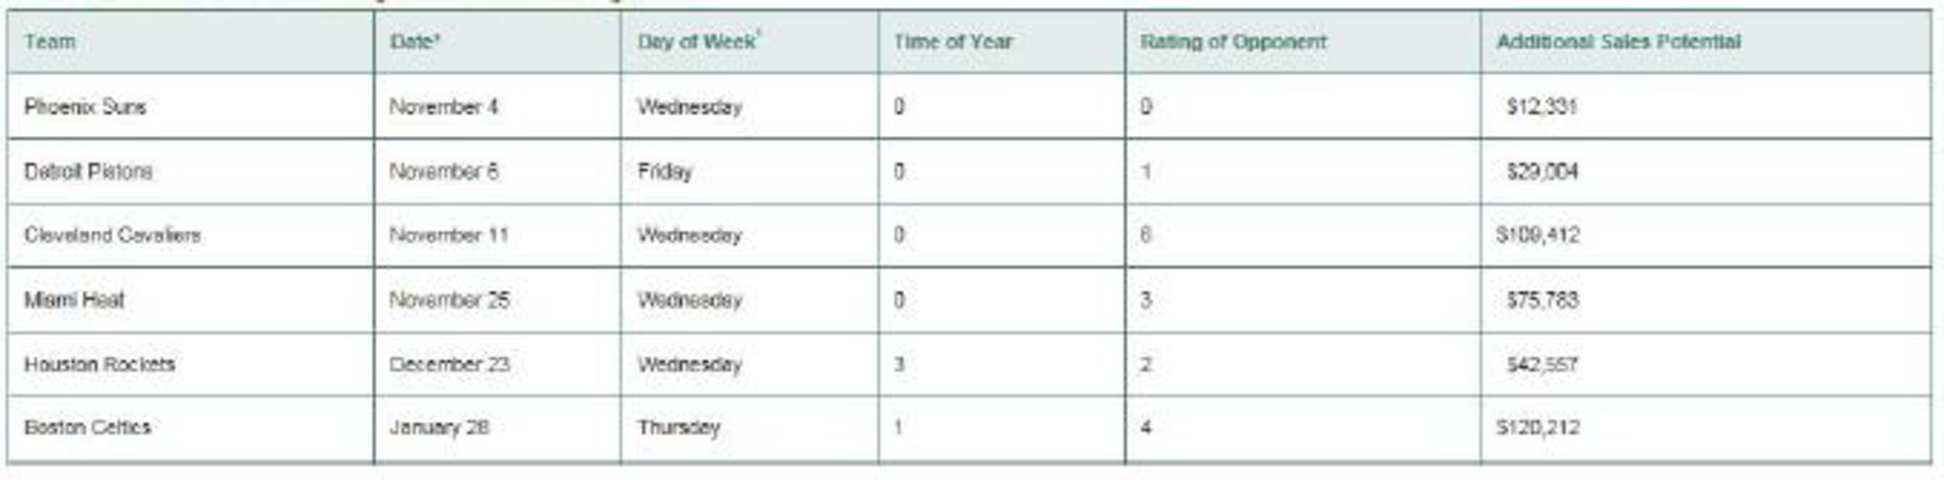
His ratings of opponents, done just before the start of the season, were subjective and range from a low of 0 to a high of 8. A very high-rated team in that particular season may have had one or more superstars on its roster, or have won the NBA finals the prior season, making it a popular fan draw.
Finally, Perez believed that the NBA season could be divided into four periods in popularity:
► Early games (which he assigned 0 scores)
► Games during the Christmas season (assigned a 3)
► Games until the All-Star break (given a 2)
► Games leading into the play-offs (scored with a 3)
The first year Perez built his multiple-regression model, the dependent variable y, which was a “potential premium revenue score,” yielded an R2 =.86 with this equation:
Table 4.2 illustrates, for brevity in this case study, a sample of 12 games that year (out of the total 41 home game regular season), including the potential extra revenue per game (y) to be expected using the variable pricing model.
A leader in NBA variable pricing, the Orlando Magic have learned that regression analysis is indeed a profitable forecasting tool.
2. Use the data to build a model with rating of the opponent as the sole independent variable.
Want to see the full answer?
Check out a sample textbook solution
Chapter 4 Solutions
Operations Management: Sustainability and Supply Chain Management (12th Edition)


- Davison Electronics manufactures three LED television monitors, identified as Model A, Model B, and Model C. Davison Electronics four manufacturing plants. Each model has its lowest possible production cost when produced at Plant 1. However, Plant 1 does not have the capacity to handle the total production of all three models. As a result, at least some of the production must be routed to the other manufacturing plants. The following table shows the minimum production requirements for next month, the plant capacities in units per month, and the production cost per unit at each plant: Model Production Cost per Unit Minimum Production Requirements Plant 1 Plant 2 Plant 3 Plant 4 A $25 $28 $37 $34 48,000 B $26 $35 $36 $41 75,000 C $20 $31 $26 $23 60,000 Production Capacity 65,000 50,000 32,000 43,000 Davison’s objective is to determine the cost-minimizing production planarrow_forwardAnecdotally, entrepreneurs frequently encounter two critical dilemmas in managing human resources: the timing of hiring and the decision regarding hiring a generalist versus a specialist for their growing venture. Deciding when to expand a team is crucial, as premature hiring (i.e., hiring too soon) can strain resources, while delayed hiring (i.e., hiring too late) might hinder growth opportunities. Moreover, the choice between hiring a generalist or a specialist depends on the specific needs and stage of the venture, with each option presenting distinct advantages and challenges. To address these issues, a management scholar seeks to identify the factors shaping the hiring cycle throughout the entrepreneurial journey and to understand the criteria for choosing between generalists and specialists at various stages of a venture. The scholar has assembled a sample of 20 experienced South African entrepreneurs who have encountered both failure and success in the financial technology…arrow_forward3. [25 pts.] Four projects are available for investment. The projects require the cash flows and yield the net present values (NPV) (in millions) shown in the following table. Project id. 1 2 Cash outflow at time 0 (million Lira) 8 8 NPV (million Lira) 12 11 3 4 6 5 8 6 If 20 million Lira is available for investment at time 0, find the investment plan that maximizes NPV. All investments are required to be 0 or 1 (fractional investment values are not permitted). a. Formulate the mathematical model. (Write the decision variables, objective function and the constraints.) [10 pts.] b. Find the optimal solution by using Branch and Bound method (Draw the branch and bound tree clearly, write also lower bounds(LB)) (Left branches x=0, right branches x =1) [15 pts.].arrow_forward
- examine the production concept and operations management, what are the key steps required to achieve success? Be specific in your response.arrow_forwardProduce a 3000 report with references on one international organization of your choice and Address the following: Provide a brief introduction of the organisation and sector it operates in, including its mission and vision statements, its core values, a summary of its financial performance and a general overview of the business’s operational activities. From the relevant literature explain the Total Quality Management (TQM) processes the chosen organization follows and identify one quality challenge/issue that the organization faced or is currently facing. Explain how the organization managed/or still managing the particular quality challenge/issue. Critically analyze whether the organization failed or succeeded in achieving and maintaining quality performance. Provide a few critical recommendations for business managers in order to highlight the importance of Total Quality Management (TQM) within an organization.arrow_forward問題2 Production system design involves determining the arrangement of workstations and the... O allocation of resources to workstations design of the process O production schedule all of the abovearrow_forward
- Elaborate on the need for and the benefits of an effective supply chain management (SCM) system in the context of a globalized and networked economy. In your answer, explain how organizations like Dell and Hewlett-Packard leverage supply chain networks to maintain competitiveness, and analyse the impact of globalization, technological advancements, and business environment changes on supply chain structures. Additionally, evaluate the key components of SCM, including distribution network configuration, inventory management, and cash-flow management, and discuss how these components contribute to creating an effective and integrated supply chain. (15) 3.2. Critically evaluate the requirements for effective inventory management within an organization. In your answer, discuss the importance of inventory accounting systems, the role of cost information (holding, ordering, and shortage costs), and the significance of classification systems like ABC analysis. Additionally, analyse how…arrow_forwardAssess the role of EDI in ensuring supply chain security and data integrity. How does EDI contribute to reducing vulnerabilities in supply chain operations, and what best practices should organizations adopt to maintain a secure and reliable EDI system? (10) 1.3. Examine how the adoption of modern EDI systems influences the strategic decision-making process in supply chain management. How does EDI provide supply chain managers with actionable insights, and what are the implications of these insights for long-term supply chain planning? (10) 1.4. Evaluate the potential challenges and risks associated with the modernization of EDI systems in supply chain management. How can organizations effectively manage these challenges to ensure successful EDI implementation and ongoing optimization? (10)arrow_forwardAnalyse the impact of integrating EDI (Electronic Data Interchange) with API (Application Programming Interface) on supply chain management, particularly focusing on how this integration enhances information flow and operational efficiency. Consider the challenges that might arise from this integration in terms of managing legacy systems alongside modern applications.arrow_forward
- 1) View the video What is Operations Management (14.01 minutes, Ctrl+Click on the link); what are your key takeaways (tie to one or more of the topics discussed in Chapters 1 and/or 2) after watching this video. (https://www.viddler.com/embed/d01189e1) Note: As a rough guideline, please try to keep the written submission to one or two paragraphs. 2) View the video What McDonald’s is serving up at its new CosMc’s Chain (3.42 mins, Ctrl+Click in the link), and answer the following questions: (https://www.youtube.com/watch?v=k7ojpUzE8q4) i) From a strategic perspective, why do you think McDonald’s is opting for this new chain rather than trying to launch the new menu in its existing restaurants? ii) What factors do you think in McDonald’s external and internal environments are driving its decision to open the CosMc’s locations? iii) How do you think this format will improve McDonald’s profit margin as compared to its regular fast-food restaurants? Note: As a…arrow_forwardSince the end of World War II, globalization has steadily increased with rapid expansion around the turn of the 21st century. What are some of the forces driving globalization and international business? What are some of the challenges of engaging in international business compared to doing business in your home country?arrow_forwardPS.53 Brother I.D. Ricks is a faculty member at BYU-Idaho whose grandchildren live in Oklahoma and California. He and his wife would like to visit their grandchildren at least once a year in these states. They currently have one vehicle with well over 100,000 miles on it, so they want to buy a newer vehicle with fewer miles and that gets better gas mileage. They are considering two options: (1) a new subcompact car that would cost $18,750 to purchase or (2) a used sedan that would cost $12,750.They anticipate that the new subcompact would get 37 miles per gallon (combined highway and around town driving) while the sedan would get 26 miles per gallon. Based on their road tripping history they expect to drive 13,000 miles per year. For the purposes of their analysis they are assuming that gas will cost $2.93 per gallon.Question: How many miles would the Ricks need to drive before the cost of these two options would be the same? (Display your answer to the nearest whole number.) (Hint:…arrow_forward
 Purchasing and Supply Chain ManagementOperations ManagementISBN:9781285869681Author:Robert M. Monczka, Robert B. Handfield, Larry C. Giunipero, James L. PattersonPublisher:Cengage Learning
 Practical Management ScienceOperations ManagementISBN:9781337406659Author:WINSTON, Wayne L.Publisher:Cengage,