
Videos
A particle moves according to a law of motion s = f(t), t ≥ 0, where t is measured in seconds and s in feet.
(a) Find the velocity at time t.
(b) What is the velocity after 1 second?
(c) When is the particle at rest?
(d) When is the particle moving in the positive direction?
(e) Find the total distance traveled during the first 6 seconds.
(f) Draw a diagram like Figure 2 to illustrate the motion of the particle.
(g) Find the acceleration at time t and after 1 second.
(h) Graph the position, velocity, and acceleration functions for 0 ≤ t ≤ 6.
(i) When is the particle speeding up? When is it slowing down?
FIGURE 2
f(t) = t3 – 8t2 + 24t
(a)
To find: The velocity at time t.
Answer to Problem 1E
The velocity at time is
Explanation of Solution
Given:
The given equation is as below.
Calculation:
Calculate the velocity at time
Differentiate the equation (1) with respect to time.
Therefore, the velocity at time
(b)
To find: The velocity after 1 second.
Answer to Problem 1E
The velocity after 1 second is
Explanation of Solution
Calculate the velocity after 1 second.
Substitute 1 for
Therefore, the velocity after 1 second is
(c)
To find: The time when particle at rest.
Answer to Problem 1E
The particle never is at rest.
Explanation of Solution
Calculate the time when particle will be at rest.
The velocity will be zero, when the particle is at rest.
Substitute 0 for
From the above equation, the value of time t doesn’t exist. Therefore, the particle never is at rest.
(d)
To find: The particle moving in the positive direction.
Answer to Problem 1E
The velocity of particle always moves in positive direction.
Explanation of Solution
Calculate the time at which the particle will be moving in the positive direction.
If speed is positive, the particle moves in positive direction whereas the speed is negative, the particle moves in negative direction.
Substitute 0 for
Therefore, the velocity at
(e)
To find: The total distance traveled during the first 6 seconds.
Answer to Problem 1E
The total distance travelled during first 6 seconds is
Explanation of Solution
Calculate the total distance traveled during first 6 seconds.
Substitute 0 for
Substitute 6 for
Therefore, the total distance travelled during first 6 seconds is
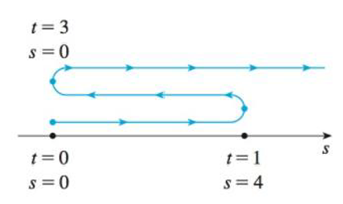
(f)
To find: The diagram to illustrate the motion of the particle.
Answer to Problem 1E
The diagram is shown in the figure (1).
Explanation of Solution
Show the diagram to illustrate the motion of the particle as shown below in figure (1).
(g)
To find: The acceleration at time t and after 1 second.
Answer to Problem 1E
The acceleration at time is
Explanation of Solution
Calculate the acceleration at time t.
Differentiate the equation (2) with respect to t.
Therefore, the acceleration at time is
Calculate the acceleration after 1 second.
Substitute 1 for
Therefore, the acceleration after 1 second is
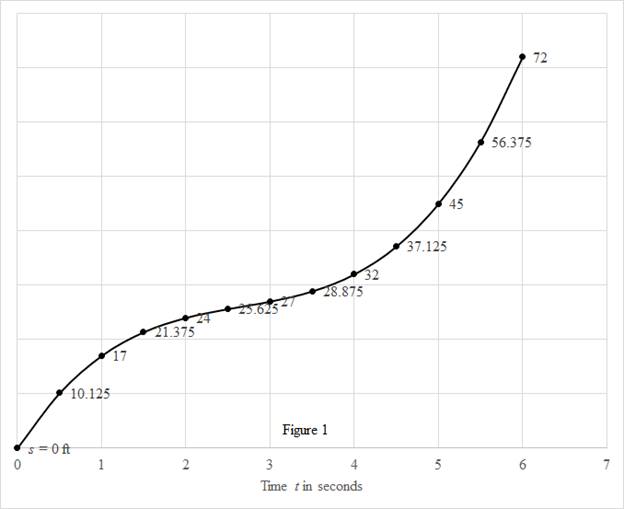
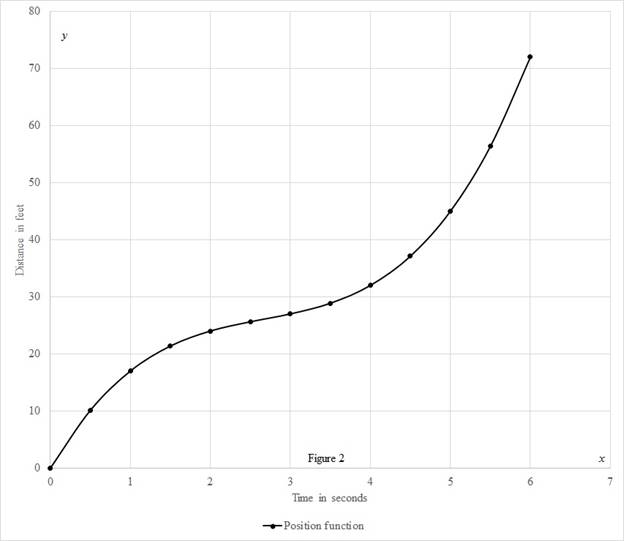
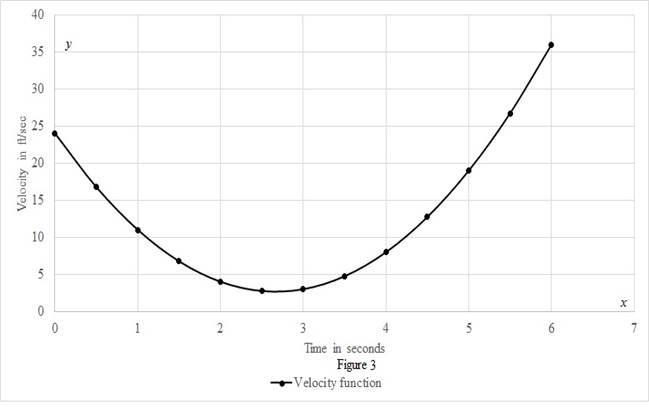
(h)
To sketch: The graph the position, velocity, and acceleration function for
Explanation of Solution
Calculate the position using the formula.
Substitute 0 for
Similarly, calculate the remaining values.
Calculate the value of
| 0 | 0 |
| 0.5 | 10.125 |
| 1 | 17 |
| 1.5 | 21.375 |
| 2 | 24 |
| 2.5 | 25.625 |
| 3 | 27 |
| 3.5 | 28.875 |
| 4 | 32 |
| 4.5 | 37.125 |
| 5 | 45 |
| 5.5 | 56.375 |
| 6 | 72 |
Calculate the velocity using the expression.
Substitute 0 for
Similarly, calculate the remaining values.
Calculate the value of
| 0 | 24 |
| 0.5 | 16.75 |
| 1 | 11 |
| 1.5 | 6.75 |
| 2 | 4 |
| 2.5 | 2.75 |
| 3 | 3 |
| 3.5 | 4.75 |
| 4 | 8 |
| 4.5 | 12.75 |
| 5 | 19 |
| 5.5 | 26.75 |
| 6 | 36 |
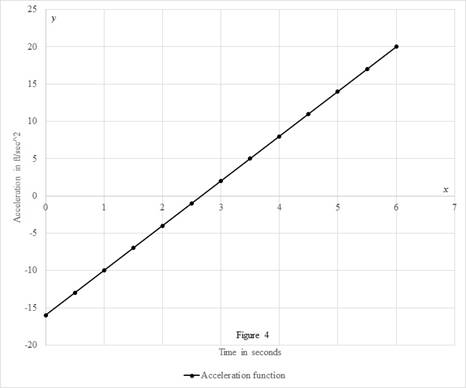
Calculate the acceleration using the formula.
Substitute 0 for
Similarly, calculate the remaining values.
Calculate the value of
| 0 | -16 |
| 0.5 | Z-13 |
| 1 | -10 |
| 1.5 | -7 |
| 2 | -4 |
| 2.5 | -1 |
| 3 | 2 |
| 3.5 | 5 |
| 4 | 8 |
| 4.5 | 11 |
| 5 | 14 |
| 5.5 | 17 |
| 6 | 20 |
Draw the position as a function of time curve as shown in the figure (1).
Draw the speed as a function of time curve as shown in the figure (2).
Draw the acceleration as a function of time curve as shown in the figure (3).
(i)
To find: The time when the particle is speeding up and slowing down.
Answer to Problem 1E
The time when the particle is speeding up is when time t is greater than
Explanation of Solution
Calculate the time when particle is speeding up and slowing down.
Substitute 0 for
Substitute
Substitute
Therefore, the acceleration is positive when the value of time is
Chapter 3 Solutions
Single Variable Calculus: Concepts and Contexts, Enhanced Edition
Additional Math Textbook Solutions
A Problem Solving Approach To Mathematics For Elementary School Teachers (13th Edition)
Precalculus: A Unit Circle Approach (3rd Edition)
Calculus: Early Transcendentals (2nd Edition)
A First Course in Probability (10th Edition)
Elementary Statistics
Finite Mathematics for Business, Economics, Life Sciences and Social Sciences


- 8. For x>_1, the continuous function g is decreasing and positive. A portion of the graph of g is shown above. For n>_1, the nth term of the series summation from n=1 to infinity a_n is defined by a_n=g(n). If intergral 1 to infinity g(x)dx converges to 8, which of the following could be true? A) summation n=1 to infinity a_n = 6. B) summation n=1 to infinity a_n =8. C) summation n=1 to infinity a_n = 10. D) summation n=1 to infinity a_n diverges.arrow_forwardPLEASE SHOW ME THE RIGHT ANSWER/SOLUTION SHOW ME ALL THE NEDDED STEP 13: If the perimeter of a square is shrinking at a rate of 8 inches per second, find the rate at which its area is changing when its area is 25 square inches.arrow_forwardDO NOT GIVE THE WRONG ANSWER SHOW ME ALL THE NEEDED STEPS 11: A rectangle has a base that is growing at a rate of 3 inches per second and a height that is shrinking at a rate of one inch per second. When the base is 12 inches and the height is 5 inches, at what rate is the area of the rectangle changing?arrow_forward
- please answer by showing all the dfalowing necessary step DO NOT GIVE ME THE WRONG ANSWER The sides of a cube of ice are melting at a rate of 1 inch per hour. When its volume is 64 cubic inches, at what rate is its volume changing?arrow_forwardSox & Sin (px) dx 0arrow_forward8 L 8 e ipx dxarrow_forward
- Find the Taylor polynomial T³(×) for the function f centered at the number a. f(x) = xe-2x a = 0 T3(x) =arrow_forwardFor each graph in Figure 16, determine whether f (1) is larger or smaller than the slope of the secant line between x = 1 and x = 1 + h for h > 0. Explain your reasoningarrow_forwardPoints z1 and z2 are shown on the graph.z1 is at (4 real,6 imaginary), z2 is at (-5 real, 2 imaginary)Part A: Identify the points in standard form and find the distance between them.Part B: Give the complex conjugate of z2 and explain how to find it geometrically.Part C: Find z2 − z1 geometrically and explain your steps.arrow_forward
- A polar curve is represented by the equation r1 = 7 + 4cos θ.Part A: What type of limaçon is this curve? Justify your answer using the constants in the equation.Part B: Is the curve symmetrical to the polar axis or the line θ = pi/2 Justify your answer algebraically.Part C: What are the two main differences between the graphs of r1 = 7 + 4cos θ and r2 = 4 + 4cos θ?arrow_forwardA curve, described by x2 + y2 + 8x = 0, has a point A at (−4, 4) on the curve.Part A: What are the polar coordinates of A? Give an exact answer.Part B: What is the polar form of the equation? What type of polar curve is this?Part C: What is the directed distance when Ø = 5pi/6 Give an exact answer.arrow_forwardNew folder 10. Find the area enclosed by the loop of the curve (1- t², t-t³)arrow_forward
 Calculus: Early TranscendentalsCalculusISBN:9781285741550Author:James StewartPublisher:Cengage Learning
 Thomas' Calculus (14th Edition)CalculusISBN:9780134438986Author:Joel R. Hass, Christopher E. Heil, Maurice D. WeirPublisher:PEARSON
 Calculus: Early Transcendentals (3rd Edition)CalculusISBN:9780134763644Author:William L. Briggs, Lyle Cochran, Bernard Gillett, Eric SchulzPublisher:PEARSON
 Calculus: Early TranscendentalsCalculusISBN:9781319050740Author:Jon Rogawski, Colin Adams, Robert FranzosaPublisher:W. H. Freeman
 Calculus: Early Transcendental FunctionsCalculusISBN:9781337552516Author:Ron Larson, Bruce H. EdwardsPublisher:Cengage Learning