Concept explainers
Videos
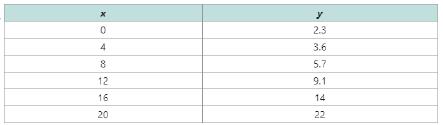
For Exercises 39-46, a table of data is given.
a. Graph the points and from visual inspection, select the model that would best fit the data. Choose from
b. Use a graphing utility to find a function that fits the data.
Want to see the full answer?
Check out a sample textbook solution
Chapter 3 Solutions
Precalculus
Additional Math Textbook Solutions
Elementary Statistics (13th Edition)
Basic Business Statistics, Student Value Edition
Elementary Statistics: Picturing the World (7th Edition)
University Calculus: Early Transcendentals (4th Edition)
Algebra and Trigonometry (6th Edition)
Calculus: Early Transcendentals (2nd Edition)


- write it down for better understanding pleasearrow_forward1. Suppose F(t) gives the temperature in degrees Fahrenheit t minutes after 1pm. With a complete sentence, interpret the equation F(10) 68. (Remember this means explaining the meaning of the equation without using any mathy vocabulary!) Include units. (3 points) =arrow_forward2. Suppose f(x) = 3x² - 5x. Show all your work for the problems below. a. Evaluate f(-3). If you have multiple steps, be sure to connect your expressions with EQUALS SIGNS. (3 points)arrow_forward
- 4c Consider the function f(x) = 10x + 4x5 - 4x³- 1. Enter the general antiderivative of f(x)arrow_forwardA tank contains 60 kg of salt and 2000 L of water. Pure water enters a tank at the rate 8 L/min. The solution is mixed and drains from the tank at the rate 11 L/min. Let y be the number of kg of salt in the tank after t minutes. The differential equation for this situation would be: dy dt y(0) =arrow_forwardSolve the initial value problem: y= 0.05y + 5 y(0) = 100 y(t) =arrow_forward
- y=f'(x) 1 8 The function f is defined on the closed interval [0,8]. The graph of its derivative f' is shown above. How many relative minima are there for f(x)? O 2 6 4 00arrow_forward60! 5!.7!.15!.33!arrow_forward• • Let > be a potential for the vector field F = (−2 y³, −6 xy² − 4 z³, −12 yz² + 4 2). Then the value of sin((-1.63, 2.06, 0.57) – (0,0,0)) is - 0.336 -0.931 -0.587 0.440 0.902 0.607 -0.609 0.146arrow_forward
- The value of cos(4M) where M is the magnitude of the vector field with potential ƒ = e² sin(лy) cos(π²) at x = 1, y = 1/4, z = 1/3 is 0.602 -0.323 0.712 -0.816 0.781 0.102 0.075 0.013arrow_forwardThere is exactly number a and one number b such that the vector field F = conservative. For those values of a and b, the value of cos(a) + sin(b) is (3ay + z, 3ayz + 3x, −by² + x) is -0.961 -0.772 -1.645 0.057 -0.961 1.764 -0.457 0.201arrow_forwardA: Tan Latitude / Tan P A = Tan 04° 30'/ Tan 77° 50.3' A= 0.016960 803 S CA named opposite to latitude, except when hour angle between 090° and 270°) B: Tan Declination | Sin P B Tan 052° 42.1'/ Sin 77° 50.3' B = 1.34 2905601 SCB is alway named same as declination) C = A + B = 1.35 9866404 S CC correction, A+/- B: if A and B have same name - add, If different name- subtract) = Tan Azimuth 1/Ccx cos Latitude) Tan Azimuth = 0.737640253 Azimuth = S 36.4° E CAzimuth takes combined name of C correction and Hour Angle - If LHA is between 0° and 180°, it is named "west", if LHA is between 180° and 360° it is named "east" True Azimuth= 143.6° Compass Azimuth = 145.0° Compass Error = 1.4° West Variation 4.0 East Deviation: 5.4 Westarrow_forward
 Glencoe Algebra 1, Student Edition, 9780079039897...AlgebraISBN:9780079039897Author:CarterPublisher:McGraw Hill
 Algebra & Trigonometry with Analytic GeometryAlgebraISBN:9781133382119Author:SwokowskiPublisher:Cengage
 Trigonometry (MindTap Course List)TrigonometryISBN:9781337278461Author:Ron LarsonPublisher:Cengage Learning