Concept explainers
Videos
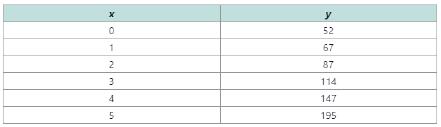
For Exercises 39-46, a table of data is given.
a. Graph the points and from visual inspection, select the model that would best fit the data. Choose from
b. Use a graphing utility to find a function that fits the data.
Want to see the full answer?
Check out a sample textbook solution
Chapter 3 Solutions
Precalculus
Additional Math Textbook Solutions
College Algebra with Modeling & Visualization (5th Edition)
Calculus: Early Transcendentals (2nd Edition)
Elementary Statistics (13th Edition)
Calculus: Early Transcendentals (2nd Edition)
Pre-Algebra Student Edition


- い ined sove in beaper Anting. Pu+965 na lake an accident and lands at the bottom of the lake Q2// Find the volume of the region in first octant bounded by the coordinate planes and the plane passing through (1, 0, 0), (0, 2, 0), and (0, 0, 3). Q/Evaluate({ } } 3xze* dydzdx.arrow_forward| Evaluate (3xze** dydzdx. ined sove in peaper +9198 PU+965 Lake Find the volume of th solid bounded above by the Cy 2=6-1 o the sides by the cylinder x+y=9, and below by the xy-planearrow_forward... +① العنوان > पर ined sove in peaper ང་ PU+965 Q2// Draw and Evaluate, or Integrate, the function f(u, v) = (1+u2+v²)3 over the region enclosed by one loop of the lemniscate (u² + v²)² - (u² + v²) = 0. Lake 2 4-2² y 7357 r QI// Evaluate f²² cos(y) dxdydz. 4-y 이arrow_forward
- し ined sove in peaper Anot in PV+96252 √4-x²-y² Q4// Convert √ √ √2x-x2 √√4-x-2_ 21xy² dzdydx to (a) cylindrical coordinates, (b) Spherical coordinates. ln3 (m3)2-x2 Q Draw and Evaluate Lake √x²+ dydarrow_forward: +0 1 R2X2 العنوان I need a detailed drawing with explanation L L 2) slots per pole per phase = 3/31 B = 180-60 msl Kd Kol, Sin (Info) Isin (6) sin(30) Sin (30) اذا ميريد شرح الكتب بس 0 بالفراغ 3) Cos (30) 0.866 4) Rotating 5) Synchronous speed, 120 x 50 6 50105 1000 S=1000-950 Loco mem 6. Copper losses: 5kw Rotor input loo kw 0.05 اذا ميريد شرح الكتب فقط look 7) rotor DC ined sove in peaper PU + 96er Which of the following is converge, and which diverge? Give reasons for your answers with details. When your answer then determine the convergence sum if possible. 5100 2n=2√²+n Lake Which of the following is converge, and which diverge? Give reasons for your answers with details. When your answer then determine the convergence sum if possible. T (3n)! 00 //Σn=1 (1+n)!(2+n)!" TH Marrow_forward۳/۱ : +♡ العنوان R2 X2 2) slots per pole per phase = 3/31 B-180-60 msl Kd Kas Sin (1) Isin (6) sin(30) Sin (30) اذا ميريد شرح الكتب بس بالفراغ 3) Cos (30) 0.866 レ× 4) Rotating 5) Synchronous speed, 120 x 50 G S=1000-950 50105 1000 looo rem > ined sove in pea Copper losses 5kw Rotor input: 5 0.05 (lookw) bos cid PU+965 Which of the following is converge, and which diverge? Give reasons for your answers with details. When your answer then determine the series' convergence if possible. 7) rotor !!Σn=1 (1-1)" が Which of the following is converge, and which diverge? Give reasons for your answers with details. When your answer then determine the series' convergence if possible. 5700 Prove that the p-series Σn=11 (p areal constant) converges if, and diverges otherwise. T Τ Lake Marrow_forward
- Vo)) %TV .. + 1 R2X2 2) slots per pole per phase = 3/31 B-180-60 msl Kol Sin () Isin () Kd تب بس بالفراغ i Cos (30) 0.866 4) Rotating ۳/۱ 5) Synchronous speed; 12 S=1000-950 50 1000 Copper losses: 5kw Rotor input 5 loo kw 0.05 6) I العنوان Which of the following is converge, and which diverge? Give reasons for your answers with details. When your answer then determine the series' convergence if possible. اذا ميريد شرح الكتب فقط ok 7) rotor ||| DC 11500 30tan¹() 2n=1' m²+1 1:11 > PV + 16°52 Which of the following is converge, and which diverge? Give reasons for your answers with details. When your answer then determine the series' convergence if possible. 7357 //Σm=1 (m²-5n+6) Lake Which of the following is converge, and which diverge? Give reasons for your answers with details. When your answer then determine the series' convergence if possible. - (3)(5+)) T d sove in peaper =T Marrow_forwardL ined sove in peaper Anoting PU+965 4 Which of the following is converge, and which diverge? Give reasons for your answers with details. When your answer then determine the convergence sum if possible. +1Σm=1 00 sin Sn Lake 55 Which of the following is converge, and which diverge? Give reasons for your answers with details. When your answer then determine the convergence sum if possible. 5700 2n=2√2+n Carrow_forwardMinistry of Higher Education & Scientific Research Babylon University College of Engineering- musayab Homobile Department Subject :Numerical Analyses Stage: Third Time: 90 min Date: 25-4-2023 2nd month exam/2nd semester (2022-2023) Note: Answer all questions, all questions have same degree. Q1:Given the values X 5 7 11 13 17 F(x) 150 392 1452 2366 5202 Evaluate f(9),using Newton's divided difference formula Q2:A slider in a machine moves along a fixed straight rod.its distance (x cm) along the rod is given below for various values of the time.Find the velocity and acceleration of the slider when t=0.3 seconds. t(seconds) 0 X (cm) 30.13 0.1 31.62 0.2 0.3 0.4 0.5 0.6 32.87 33.64 33.95 33.81 33.24 Q3:From the following table,find the area bounded by the curve and x- axis,between the ordinates x=7.74 to x=7.52 using Simpson's 1/3 rule. X y=f(x) 7.47 7.48 1.93 1.95 7.49 1.98 7.50 7.51 7.52 2.01 2.03 2.06 Q4:Given y+x with initial condition y=1 at x=0;find (y) for x=0.1 by Euler's method.…arrow_forward
- V ined sove in peaper Pu+96er Which of the following is converge, and which diverge? Give reasons for your answers with details. When your answer then determine the convergence sum if possible. 21/11 55 a Which of the following is converge, and which diverge? Give reasons for your answers with details. When your answer then determine the convergence sum if possible. 1Σn=1 (2-") n° 3" 6"arrow_forwardL ined sove in peaper Anoting PU+965 4 Which of the following is converge, and which diverge? Give reasons for your answers with details. When your answer then determine the convergence sum if possible. +1Σm=1 00 sin Sn Lake 55 Which of the following is converge, and which diverge? Give reasons for your answers with details. When your answer then determine the convergence sum if possible. 5700 2n=2√2+n Carrow_forwarda い पीर ined sove in peaper Pu+9625 Which of the following is converge, and which diverge? Give reasons for your answers with details. When your answer then determine the convergence sum if possible. 3" 6" 1Σn=1 (2-") n Lake = Which of the following is converge, and which diverge? Give reasons for your answers with details. When your answer then determine the convergence sum 1/n 2" (n-√n -n 2n-1 0 T=1 . if possible.arrow_forward

 Glencoe Algebra 1, Student Edition, 9780079039897...AlgebraISBN:9780079039897Author:CarterPublisher:McGraw Hill
 Algebra & Trigonometry with Analytic GeometryAlgebraISBN:9781133382119Author:SwokowskiPublisher:Cengage
 Trigonometry (MindTap Course List)TrigonometryISBN:9781337278461Author:Ron LarsonPublisher:Cengage Learning