
Campbell Biology: Concepts & Connections, Books a la Carte Plus Mastering Biology with eText -- Access Card Package (8th Edition)
8th Edition
ISBN: 9780133909029
Author: Jane B. Reece, Martha R. Taylor, Eric J. Simon, Jean L. Dickey, Kelly A. Hogan
Publisher: PEARSON
expand_more
expand_more
format_list_bulleted
Concept explainers
Videos
Textbook Question
Chapter 36, Problem 2CC
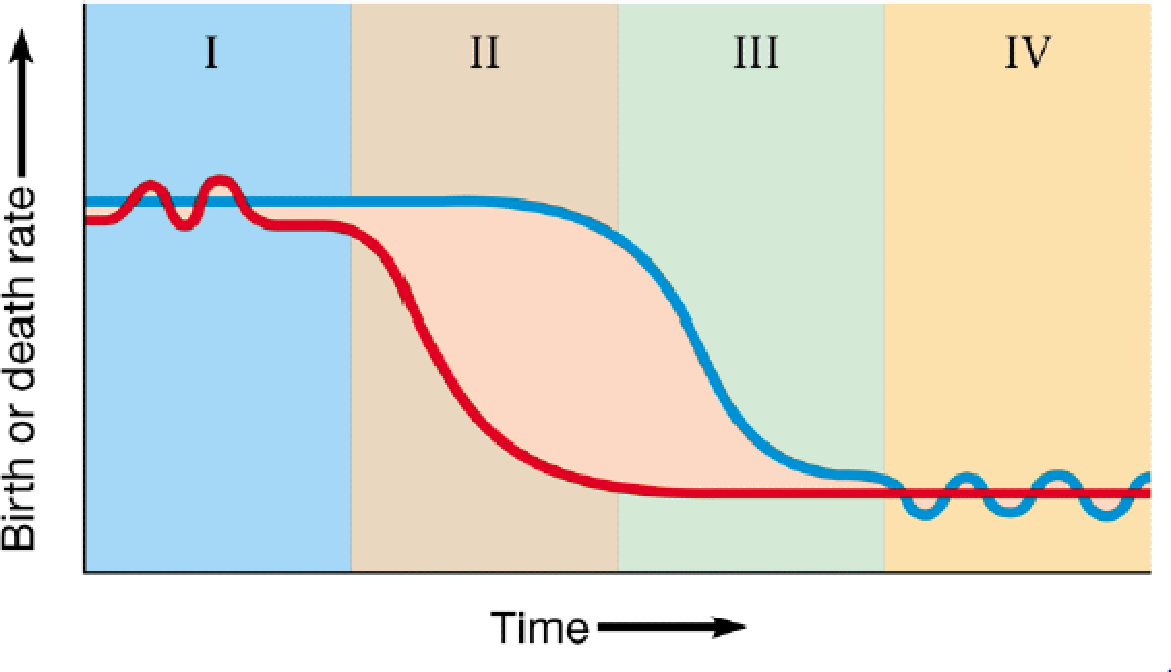
The graph below shows the demographic transition for a hypothetical country. Many developed countries that have achieved a stable
a. What does the blue line represent? The red line?
b. This diagram has been divided into four sections. Describe what is happening in each section.
c. In which section(s) is the population size stable?
d. In which section is the
Expert Solution & Answer

Trending nowThis is a popular solution!

Students have asked these similar questions
When taking vitamins and vitamin-mineral supplements, how can one be sure they are getting what they are taking?
How many milligrams of zinc did you consume on average per day over the 3 days? (See the Actual Intakes vs. Recommended Intakes Report with all days checked.)
Enter the number of milligrams of zinc rounded to the first decimal place in the box below.
______ mg ?
the direct output from molecular replacement is a coordinate file showing the orientation of the unknown target protein in the unit cell. true or false?
Chapter 36 Solutions
Campbell Biology: Concepts & Connections, Books a la Carte Plus Mastering Biology with eText -- Access Card Package (8th Edition)
Ch. 36 - Use this graph of the idealized exponential and...Ch. 36 - The graph below shows the demographic transition...Ch. 36 - Prob. 3TYKCh. 36 - To figure out the human population density of your...Ch. 36 - The term (K N)/K a. is the carrying capacity for...Ch. 36 - With regard to its rate of growth, a population...Ch. 36 - Prob. 7TYKCh. 36 - Skyrocketing growth of the human population...Ch. 36 - Prob. 9TYKCh. 36 - What are some factors that might have a...
Knowledge Booster


Learn more about
Need a deep-dive on the concept behind this application? Look no further. Learn more about this topic, biology and related others by exploring similar questions and additional content below.Similar questions
- the direct output from molecular replacement is a coordinate file showing the orientation of the unknown target protein in the unit cell. true or false?arrow_forwardDid your intake of vitamin C meet or come very close to the recommended amount? yes noarrow_forwardWhich of the following statements about hydration is true? Absence of thirst is a reliable indication that an individual is adequately hydrated. All of these statements are true. Although a popular way to monitor hydration status, weighing yourself before and after intensive physical activity is not a reliable method to monitor hydration. Urine that is the color of apple juice indicates dehydration. I don't know yetarrow_forward
- Three of the many recessive mutations in Drosophila melanogaster that affect body color, wing shape, or bristle morphology are black (b) body versus grey in wild type, dumpy (dp), obliquely truncated wings versus long wings in the male, and hooked (hk) bristles versus not hooked in the wild type. From a cross of a dumpy female with a black and hooked male, all of the F1 were wild type for all three of the characters. The testcross of an F1 female with a dumpy, black, hooked male gave the following results: Trait Number of individuals Wild type 169 Black 19 Black, hooked 301 Dumpy, hooked 21 Hooked, dumpy, black 172 Dumpy, black 6 Dumpy 305 Hooked 8 Determine the order of the genes and the mapping distance between genes. Determine the coefficient of confidence for the portion of the chromosome involved in the cross. How much interference takes place in the cross?arrow_forwardWhat happens to a microbes membrane at colder temperature?arrow_forwardGenes at loci f, m, and w are linked, but their order is unknown. The F1 heterozygotes from a cross of FFMMWW x ffmmww are test crossed. The most frequent phenotypes in the test cross progeny will be FMW and fmw regardless of what the gene order turns out to be. What classes of testcross progeny (phenotypes) would be least frequent if locus m is in the middle? What classes would be least frequent if locus f is in the middle? What classes would be least frequent if locus w is in the middle?arrow_forward
- 1. In the following illustration of a phospholipid... (Chemistry Primer and Video 2-2, 2-3 and 2-5) a. Label which chains contain saturated fatty acids and non-saturated fatty acids. b. Label all the areas where the following bonds could form with other molecules which are not shown. i. Hydrogen bonds ii. Ionic Bonds iii. Hydrophobic Interactions 12-6 HICIH HICIH HICHH HICHH HICIH OHHHHHHHHHHHHHHHHH C-C-C-C-C-c-c-c-c-c-c-c-c-c-c-c-C-C-H HH H H H H H H H H H H H H H H H H H HO H-C-O H-C-O- O O-P-O-C-H H T HICIH HICIH HICIH HICIH HHHHHHH HICIH HICIH HICIH 0=C HIC -C-C-C-C-C-C-C-C-CC-C-C-C-C-C-C-C-C-H HHHHHHHHH IIIIIIII HHHHHHHH (e-osbiv)arrow_forwardAnswer this as a dental assistant studentarrow_forwardbuatkan judul skripsi tentang parasitologi yang sedang trendinharrow_forward
- Dental assistantarrow_forwardO Macmillan Learning Glu-His-Trp-Ser-Gly-Leu-Arg-Pro-Gly The pKa values for the peptide's side chains, terminal amino groups, and carboxyl groups are provided in the table. Amino acid Amino pKa Carboxyl pKa Side-chain pKa glutamate 9.60 2.34 histidine 9.17 1.82 4.25 6.00 tryptophan 9.39 2.38 serine 9.15 2.21 glycine 9.60 2.34 leucine 9.60 2.36 arginine 9.04 2.17 12.48 proline 10.96 1.99 Calculate the net charge of the molecule at pH 3. net charge at pH 3: Calculate the net charge of the molecule at pH 8. net charge at pH 8: Calculate the net charge of the molecule at pH 11. net charge at pH 11: Estimate the isoelectric point (pl) for this peptide. pl:arrow_forwardBiology Questionarrow_forward
arrow_back_ios
SEE MORE QUESTIONS
arrow_forward_ios
Recommended textbooks for you
 Biology (MindTap Course List)BiologyISBN:9781337392938Author:Eldra Solomon, Charles Martin, Diana W. Martin, Linda R. BergPublisher:Cengage Learning
 Case Studies In Health Information ManagementBiologyISBN:9781337676908Author:SCHNERINGPublisher:Cengage
 Concepts of BiologyBiologyISBN:9781938168116Author:Samantha Fowler, Rebecca Roush, James WisePublisher:OpenStax College
 Human Biology (MindTap Course List)BiologyISBN:9781305112100Author:Cecie Starr, Beverly McMillanPublisher:Cengage Learning
 Human Heredity: Principles and Issues (MindTap Co...BiologyISBN:9781305251052Author:Michael CummingsPublisher:Cengage Learning
Biology (MindTap Course List)
Biology
ISBN:9781337392938
Author:Eldra Solomon, Charles Martin, Diana W. Martin, Linda R. Berg
Publisher:Cengage Learning
Case Studies In Health Information Management
Biology
ISBN:9781337676908
Author:SCHNERING
Publisher:Cengage
Concepts of Biology
Biology
ISBN:9781938168116
Author:Samantha Fowler, Rebecca Roush, James Wise
Publisher:OpenStax College
Human Biology (MindTap Course List)
Biology
ISBN:9781305112100
Author:Cecie Starr, Beverly McMillan
Publisher:Cengage Learning
Human Heredity: Principles and Issues (MindTap Co...
Biology
ISBN:9781305251052
Author:Michael Cummings
Publisher:Cengage Learning
POPULATION REGULATION AND LIMITING FACTORS | DENSITY INDEPENDENT AND DENSITY DEPENDENT FACTORS; Author: BioVidyalaya;https://www.youtube.com/watch?v=mB-AB-5Wnhs;License: Standard YouTube License, CC-BY
Population growth; Author: SiouxScience;https://www.youtube.com/watch?v=XnaC9iOumVA;License: Standard YouTube License, CC-BY