
Bundle: Introduction to Statistics and Data Analysis, 5th + WebAssign Printed Access Card: Peck/Olsen/Devore. 5th Edition, Single-Term
5th Edition
ISBN: 9781305620711
Author: Roxy Peck, Chris Olsen, Jay L. Devore
Publisher: Cengage Learning
expand_more
expand_more
format_list_bulleted
Concept explainers
Videos
Textbook Question
Chapter 3.5, Problem 48E
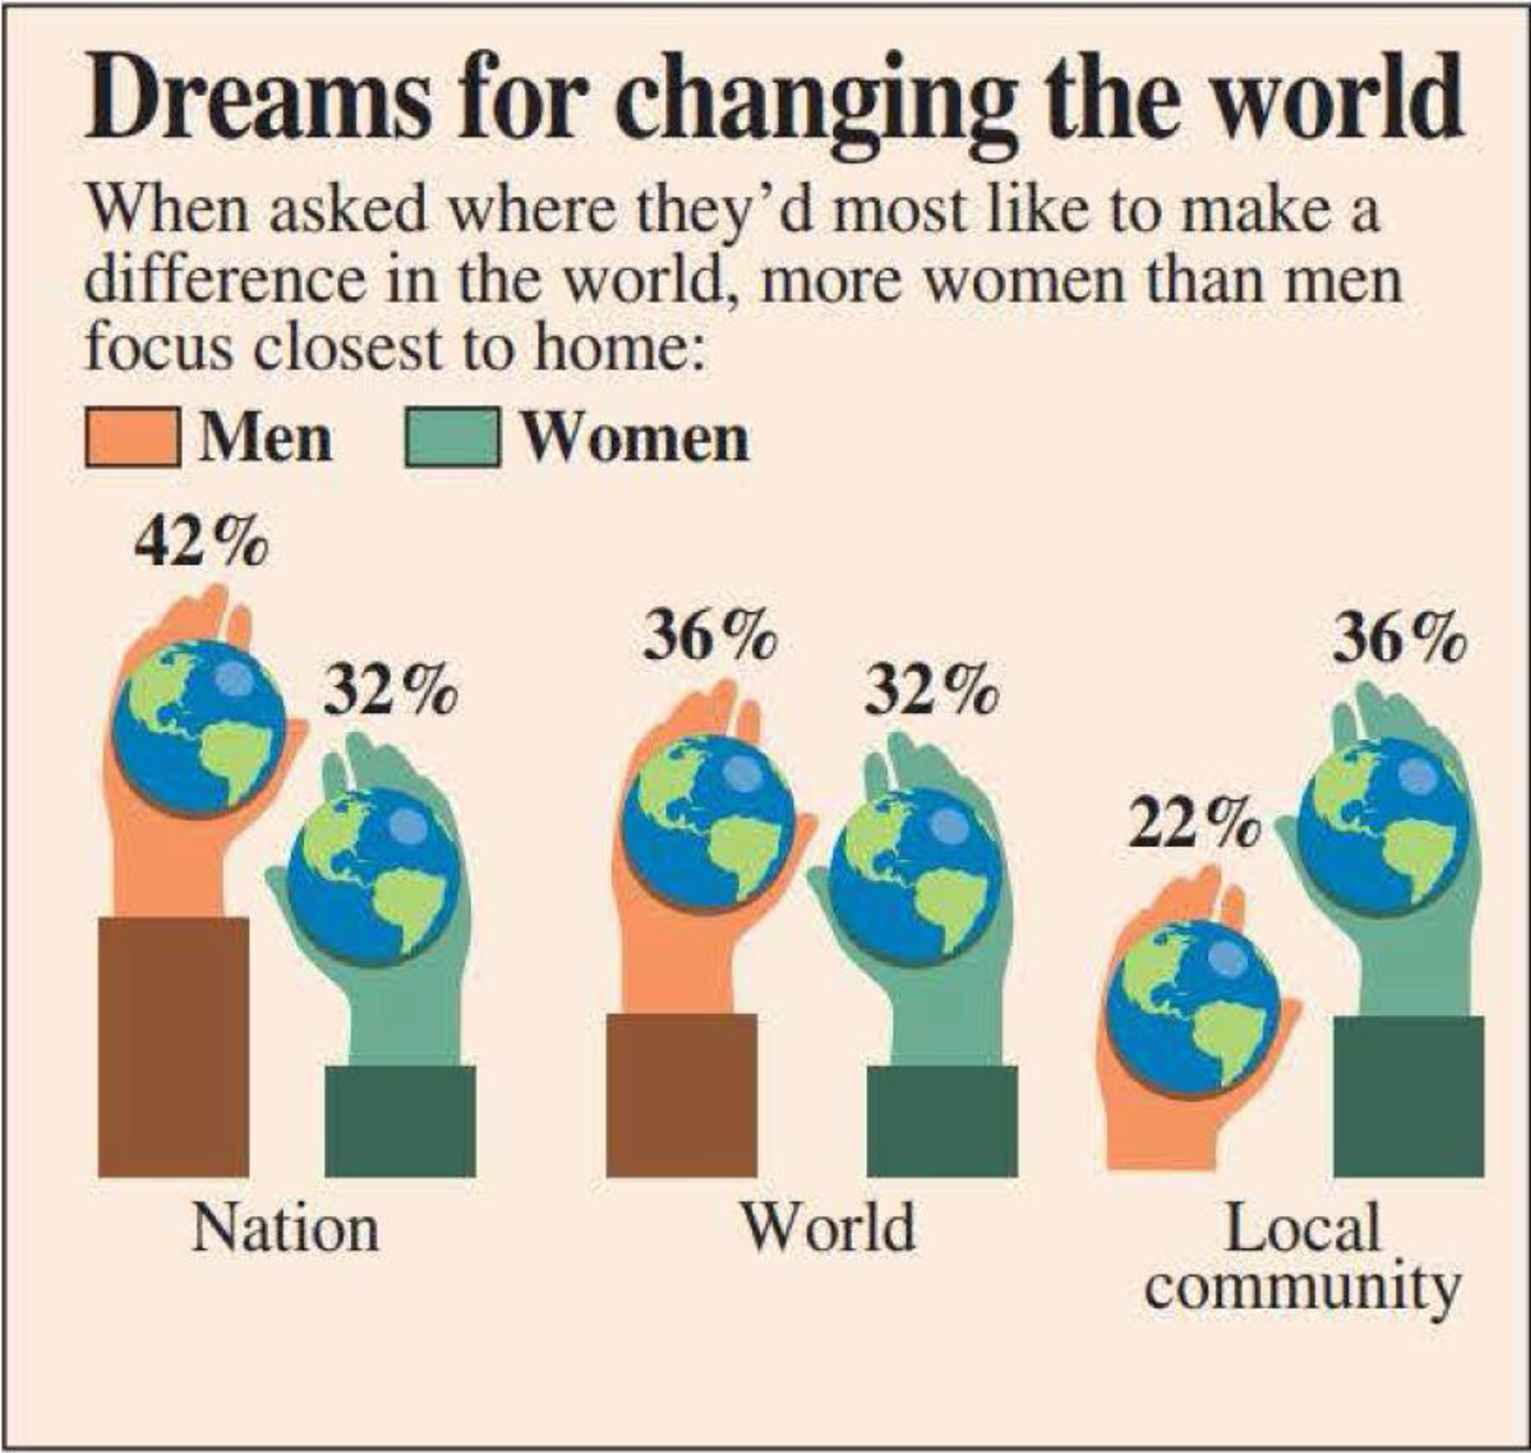
The figure at the top right of the next page is similar to one that appeared in USA TODAY (August 5, 2008). This graph is a modified comparative bar chart. Most likely, the modifications (incorporating hands and the earth) were made to try to make a display that readers would find more interesting.
- a. Use the information in the USA TODAY graph to construct a traditional comparative bar chart.
- b. Explain why the modifications made in the USA TODAY graph may make interpretation more difficult than with the traditional comparative bar chart.
Expert Solution & Answer

Trending nowThis is a popular solution!

Students have asked these similar questions
A public health researcher is studying the impacts of nudge marketing techniques on shoppers vegetables
The director of admissions at Kinzua University in Nova Scotia estimated the distribution of student admissions for the fall semester on the basis of past experience.
Admissions
Probability
1,100
0.5
1,400
0.4
1,300
0.1
Click here for the Excel Data File
Required:
What is the expected number of admissions for the fall semester?
Compute the variance and the standard deviation of the number of admissions.
Note: Round your standard deviation to 2 decimal places.
A pollster randomly selected four of 10 available people.
Required:
How many different groups of 4 are possible?
What is the probability that a person is a member of a group?
Note: Round your answer to 3 decimal places.
Chapter 3 Solutions
Bundle: Introduction to Statistics and Data Analysis, 5th + WebAssign Printed Access Card: Peck/Olsen/Devore. 5th Edition, Single-Term
Ch. 3.1 - Each person in a nationally representative sample...Ch. 3.1 - The graphical display on the next page is similar...Ch. 3.1 - Prob. 3ECh. 3.1 - The National Confectioners Association asked 1006...Ch. 3.1 - College student attitudes about e-books were...Ch. 3.1 - Prob. 6ECh. 3.1 - Prob. 7ECh. 3.1 - Prob. 8ECh. 3.1 - Prob. 9ECh. 3.1 - The survey on student attitude toward e-books...
Ch. 3.1 - Prob. 11ECh. 3.1 - Prob. 12ECh. 3.1 - An article about college loans (New Rules Would...Ch. 3.1 - Prob. 14ECh. 3.2 - Prob. 15ECh. 3.2 - Prob. 16ECh. 3.2 - Prob. 17ECh. 3.2 - The article Economy Low, Generosity High (USA...Ch. 3.2 - Prob. 19ECh. 3.2 - A report from Texas Transportation Institute...Ch. 3.2 - The percentage of teens not in school or working...Ch. 3.3 - Prob. 22ECh. 3.3 - The accompanying data on annual maximum wind speed...Ch. 3.3 - The accompanying relative frequency table is based...Ch. 3.3 - Prob. 25ECh. 3.3 - Medicares new medical plans offer a wide range of...Ch. 3.3 - The following two relative frequency distributions...Ch. 3.3 - Prob. 28ECh. 3.3 - The report Trends in College Pricing 2012...Ch. 3.3 - An exam is given to students in an introductory...Ch. 3.3 - The accompanying frequency distribution summarizes...Ch. 3.3 - Example 3.19 used annual rainfall data for...Ch. 3.3 - Prob. 33ECh. 3.3 - Prob. 34ECh. 3.3 - Prob. 35ECh. 3.3 - Prob. 36ECh. 3.3 - Using the five class intervals 100 to 120, 120 to...Ch. 3.4 - Prob. 38ECh. 3.4 - Consumer Reports Health (consumerreports.org) gave...Ch. 3.4 - Prob. 40ECh. 3.4 - Prob. 41ECh. 3.4 - Prob. 42ECh. 3.4 - Prob. 43ECh. 3.4 - Prob. 44ECh. 3.4 - The accompanying time series plot of movie box...Ch. 3.5 - The accompanying comparative bar chart is similar...Ch. 3.5 - Prob. 47ECh. 3.5 - The figure at the top right of the next page is...Ch. 3.5 - The two graphical displays below are similar to...Ch. 3.5 - The following graphical display is similar to one...Ch. 3.5 - Explain why the following graphical display...Ch. 3 - Prob. 52CRCh. 3 - Prob. 53CRCh. 3 - Prob. 54CRCh. 3 - The Connecticut Agricultural Experiment Station...Ch. 3 - The stem-and-leaf display of Exercise 3.55 uses...Ch. 3 - Prob. 57CRCh. 3 - Prob. 58CRCh. 3 - Does the size of a transplanted organ matter? A...Ch. 3 - Prob. 60CRCh. 3 - Prob. 61CRCh. 3 - Prob. 62CRCh. 3 - The article Tobacco and Alcohol Use in G-Rated...Ch. 3 - Prob. 64CRCh. 3 - Prob. 65CRCh. 3 - Prob. 66CRCh. 3 - Prob. 67CRCh. 3 - Prob. 68CRCh. 3 - Prob. 69CRCh. 3 - Many nutritional experts have expressed concern...Ch. 3 - Americium 241 (241Am) is a radioactive material...Ch. 3 - Does eating broccoli reduce the risk of prostate...Ch. 3 - An article that appeared in USA TODAY (August 11,...Ch. 3 - Sometimes samples are composed entirely of...Ch. 3 - Prob. 4CRECh. 3 - More than half of Californias doctors say they are...Ch. 3 - Based on observing more than 400 drivers in the...Ch. 3 - An article from the Associated Press (May 14,...Ch. 3 - Prob. 8CRECh. 3 - Prob. 9CRECh. 3 - Prob. 10CRECh. 3 - The article Determination of Most Representative...Ch. 3 - The paper Lessons from Pacemaker Implantations...Ch. 3 - How does the speed of a runner vary over the...Ch. 3 - Prob. 14CRECh. 3 - One factor in the development of tennis elbow, a...Ch. 3 - An article that appeared in USA TODAY (September...
Additional Math Textbook Solutions
Find more solutions based on key concepts
1. How is a sample related to a population?
Elementary Statistics: Picturing the World (7th Edition)
Check Your Understanding
Reading Check Complete each sentence using > or < for □.
RC1. 3 dm □ 3 dam
Basic College Mathematics
Empirical versus Theoretical A Monopoly player claims that the probability of getting a 4 when rolling a six-si...
Introductory Statistics
First Derivative Test a. Locale the critical points of f. b. Use the First Derivative Test to locale the local ...
Calculus: Early Transcendentals (2nd Edition)
Provide an example of a qualitative variable and an example of a quantitative variable.
Elementary Statistics ( 3rd International Edition ) Isbn:9781260092561
NOTE: Write your answers using interval notation when appropriate.
CHECKING ANALYTIC SKILLS Fill in each blank ...
Graphical Approach To College Algebra
Knowledge Booster


Learn more about
Need a deep-dive on the concept behind this application? Look no further. Learn more about this topic, statistics and related others by exploring similar questions and additional content below.Similar questions
- Wind Mountain is an archaeological study area located in southwestern New Mexico. Potsherds are broken pieces of prehistoric Native American clay vessels. One type of painted ceramic vessel is called Mimbres classic black-on-white. At three different sites the number of such sherds was counted in local dwelling excavations. Test given. Site I Site II Site III 63 19 60 43 34 21 23 49 51 48 11 15 16 46 26 20 31 Find .arrow_forwardRothamsted Experimental Station (England) has studied wheat production since 1852. Each year many small plots of equal size but different soil/fertilizer conditions are planted with wheat. At the end of the growing season, the yield (in pounds) of the wheat on the plot is measured. Suppose for a random sample of years, one plot gave the following annual wheat production (in pounds): 4.46 4.21 4.40 4.81 2.81 2.90 4.93 3.54 4.16 4.48 3.26 4.74 4.97 4.02 4.91 2.59 Use a calculator to verify that the sample variance for this plot is . Another random sample of years for a second plot gave the following annual wheat production (in pounds): 3.89 3.81 3.95 4.07 4.01 3.73 4.02 3.78 3.72 3.96 3.62 3.76 4.02 3.73 3.94 4.03 Use a calculator to verify that the sample variance for this plot is . Suppose that we test the claim using that the population variance of annual wheat production for the first plot is larger…arrow_forwardIt is thought that prehistoric Native Americans did not take their best tools, pottery, and household items when they visited higher elevations for their summer camps. It is hypothesized that archaeological sites tend to lose their cultural identity and specific cultural affiliation as the elevation of the site increases. Let x be the elevation (in thousands of feet) for an archaeological site in the southwestern United States. Let y be the percentage of unidentified artifacts (no specific cultural affiliation) at a given elevation. Suppose that the following data were obtained for a collection of archaeological sites in New Mexico: x 5.50 6.00 6.75 7.00 7.75 y 37 38 92 70 99 Find the equation of the least squares line . Round a and b to three decimal places.arrow_forward
- A fitness trainer wants to estimate the effect of fitness activities on muscle mass for different weight categories of club members. They choose the most popular fitness classes at the gym: yoga, circuit training, and high-intensity interval training (HIIT). Suppose that the weights of club members are separated into three levels: under 155 pounds, 155 – 200 pounds, and over 200 pounds. Draw a flow chart showing the design of this experiment.arrow_forwardThe systolic blood pressure of individuals is thought to be related to both age and weight. Let the systolic blood pressure, age, and weight be represented by the variables x1, x2, and x3, respectively. Suppose that Minitab was used to generate the following descriptive statistics, correlations, and regression analysis for a random sample of 15 individuals. Descriptive Statistics Variable N Mean Median TrMean StDev SE Mean x 1 15 154.14 154.34 154.14 3.842 0.992000 x 2 15 59.69 60.19 59.69 1.462 0.377487 x 3 15 205.55 204.75 205.55 4.558 1.176871 Variable Minimum Maximum Q1 Q3 x 1 125 178 141.803 167.244 x 2 41 80 47.754 78.415 x 3 126 240 140.395 224.008 Correlations (Pearson) x 1 x 2 x 2 0.892 x 3 0.839 0.567 Regression Analysis The regression equation is x 1 = 0.883 + 1.257x2 + 0.871x3 Predictor Coef StDev T P Constant 0.883 0.635 1.39 0.095 x 2 1.257 0.635 1.98 0.036 x 3 0.871 0.419 2.08 0.030 S = 0.428 R-sq = 92.7 %…arrow_forwardAccording to health professionals, a person’s weight is expected to increase with age. To examine that statement, a nutritionist collected data from 11 random females from different age categories between the ages of 21 and 43. In the following table, x is the age of a person and y is the weight in pounds. x, age 21 24 27 29 31 33 35 38 40 42 43 y, weight in lb 121.4 122.3 130.3 131.7 133.3 134.6 136.7 138.4 140.3 142.0 145.1 Select the correct graph of the least-squares line on a scatter diagram.arrow_forward
- Let x be a random variable that represents the percentage of successful free throws a professional basketball player makes in a season. Let y be a random variable that represents the percentage of successful field goals a professional basketball player makes in a season. A random sample of n = 6 professional basketball players gave the following information. x 82 69 73 84 74 64 y 42 48 46 46 46 42 Verify that ∑x =446, ∑y =270, ∑x2 =33,442, ∑y2 =12,180, ∑xy =20,070, and r = 0, and find the critical value for a test using a 5% level of significance claiming that ρis not equal than zero. Round your answer to three decimal places.arrow_forwardLet x be a random variable that represents the percentage of successful free throws a professional basketball player makes in a season. Let y be a random variable that represents the percentage of successful field goals a professional basketball player makes in a season. A random sample of n = 6 professional basketball players gave the following information. x 75 72 75 81 74 81 y 46 39 42 47 49 50 Verify that Se ࣈ 3.591,a ࣈ –10.145, bࣈ0.729, and , and find the predicted percentage of successful field goals for a player with x= 88%successful free throws. Round your answer to the nearest tenth of a percentarrow_forwardAn editor wants to analyze if there is a significant difference in the ratings of books in four different genres. Random samples of book ratings were collected for four different genres. The editor recorded ratings in a 0 to 10 scale in the following table. Fiction Novel Biography Science&Technology 8.5 8.4 6.2 9.1 5.3 5.3 5.5 4.3 7.7 4.2 7.0 9.7 5.1 9.8 9.3 5.2 6.9 8.6 6.7 7.9 4.8 7.1 6.9 8.4 Shall we reject or not reject the claim that there are no differences among the population means of book ratings for the different genres? Use.arrow_forward
- Peggy conducted a study to identify the randomness of rainy days in fall. For 15 days, she recorded whether it rained that day or not. They denoted a rainy day with the letter R, a day without rain with the letter N. R N N R R N N R R N N R R R R Test the sequence for randomness. Use .arrow_forwardConsider the grades for the math and history exams for 10 students on a scale from 0 to 12 in the following table. Student Math History 1 4 8 2 5 9 3 7 9 4 12 10 5 10 8 6 8 5 7 9 6 8 9 6 9 11 9 10 7 10 Compute the Spearman correlation coefficient. Round your answer to three decimal places.arrow_forwardTo compare two elementary schools regarding teaching of reading skills, 12 sets of identical twins were used. In each case, one child was selected at random and sent to school A, and his or her twin was sent to school B. Near the end of fifth grade, an achievement test was given to each child. The results follow: Twin Pair 1 2 3 4 5 6 School A 169 157 115 99 119 113 School B 123 157 112 99 121 122 Twin Pair 7 8 9 10 11 12 School A 120 121 124 145 138 117 School B 153 90 124 140 142 102 Suppose a sign test for matched pairs with a 1% level of significance is used to test the hypothesis that the schools have the same effectiveness in teaching reading skills against the alternate hypothesis that the schools have different levels of effectiveness in teaching reading skills. Let p denote portion of positive signs when the scores of school B are subtracted from the corresponding scores of school…arrow_forward
arrow_back_ios
SEE MORE QUESTIONS
arrow_forward_ios
Recommended textbooks for you
 Holt Mcdougal Larson Pre-algebra: Student Edition...AlgebraISBN:9780547587776Author:HOLT MCDOUGALPublisher:HOLT MCDOUGAL
Holt Mcdougal Larson Pre-algebra: Student Edition...
Algebra
ISBN:9780547587776
Author:HOLT MCDOUGAL
Publisher:HOLT MCDOUGAL
Finding the length of an arc; Author: Maths Genie;https://www.youtube.com/watch?v=fWGPf5peCc8;License: Standard YouTube License, CC-BY
Circles, Angle Measures, Arcs, Central & Inscribed Angles, Tangents, Secants & Chords - Geometry; Author: The Organic Chemistry Tutor;https://www.youtube.com/watch?v=nd46bA9DKE0;License: Standard Youtube License