
Fundamentals of Statistics (5th Edition)
5th Edition
ISBN: 9780134508306
Author: Michael Sullivan III
Publisher: PEARSON
expand_more
expand_more
format_list_bulleted
Videos
Textbook Question
Chapter 3.4, Problem 21AYU
NW SMART Car The data on the following page represent the miles per gallon of a random sample of SMART cars with a three-cylinder, 1.0-liter engine.
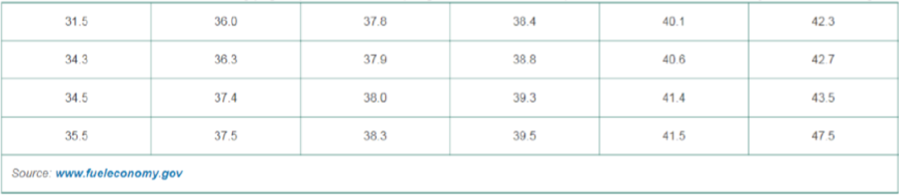
- a. Compute the z-score corresponding to the individual who obtained 36.3 miles per gallon. Interpret this result.
- b. Determine the
quartiles. - c. Compute and interpret the
interquartile range , IQR. - d. Determine the lower and upper fences. Are there any outliers?
Expert Solution & Answer

Trending nowThis is a popular solution!

Students have asked these similar questions
You assume that the annual incomes for certain workers are normal with a mean of $28,500 and a standard deviation of $2,400.
What’s the chance that a randomly selected employee makes more than $30,000?What’s the chance that 36 randomly selected employees make more than $30,000, on average?
What’s the chance that a fair coin comes up heads more than 60 times when you toss it 100 times?
Suppose that you have a normal population of quiz scores with mean 40 and standard deviation 10.
Select a random sample of 40. What’s the chance that the mean of the quiz scores won’t exceed 45?Select one individual from the population. What’s the chance that his/her quiz score won’t exceed 45?
Chapter 3 Solutions
Fundamentals of Statistics (5th Edition)
Ch. 3.1 - What does it mean if a statistic is resistant?Ch. 3.1 - In the 2014 Current Population Survey conducted by...Ch. 3.1 - The U.S. Department of Housing and Urban...Ch. 3.1 - A histogram of a set of data indicates that the...Ch. 3.1 - If a data set contains 10,000 values arranged in...Ch. 3.1 - True or False: A data set will always have exactly...Ch. 3.1 - In Problems 710, find the population mean or...Ch. 3.1 - In Problems 710, find the population mean or...Ch. 3.1 - In Problems 710, find the population mean or...Ch. 3.1 - In Problems 710, find the population mean or...
Ch. 3.1 - For Super Bowl XLVII, there were 82,566 tickets...Ch. 3.1 - The median for the given set of six ordered data...Ch. 3.1 - Miles per Gallon The following data represent the...Ch. 3.1 - Exam Time The following data represent the amount...Ch. 3.1 - NW Concrete Mix A certain type of concrete mix is...Ch. 3.1 - Flight Time The following data represent the...Ch. 3.1 - For each of the three histograms shown, determine...Ch. 3.1 - Match the histograms shown to the summary...Ch. 3.1 - Exam Scores The data in the next column represent...Ch. 3.1 - pH in Water The acidity or alkalinity of a...Ch. 3.1 - NW Pulse Rates The following data represent the...Ch. 3.1 - Travel Time The data represent the travel time (in...Ch. 3.1 - NW Connection Time A histogram of the connection...Ch. 3.1 - Journal Costs A histogram of the annual...Ch. 3.1 - MMs The following data represent the weights (in...Ch. 3.1 - Old Faithful We have all heard of the Old Faithful...Ch. 3.1 - Hours Working A random sample of 25 college...Ch. 3.1 - Prob. 28AYUCh. 3.1 - NW Political Views A sample of 30 registered...Ch. 3.1 - Prob. 30AYUCh. 3.1 - Prob. 31AYUCh. 3.1 - Mr. Zuro finds the mean height of all 14 students...Ch. 3.1 - Missing Exam Grade A professor has recorded exam...Ch. 3.1 - Prob. 34AYUCh. 3.1 - Blood Alcohol Concentration Go to...Ch. 3.1 - Prob. 36AYUCh. 3.1 - Linear Transformations Benjamin owns a small...Ch. 3.1 - Linear Transformations Use the five test scores of...Ch. 3.1 - Trimmed Mean Another measure of central tendency...Ch. 3.1 - Prob. 40AYUCh. 3.1 - Putting It Together: Shape, Mean and Median As...Ch. 3.1 - FICO Scores The Fair Isaacs Corporation has...Ch. 3.1 - Why is the median resistant, but the mean is not?Ch. 3.1 - Prob. 44AYUCh. 3.1 - Net Worth According to a Credit Suisse Survey, the...Ch. 3.1 - Prob. 46AYUCh. 3.1 - In January 2016, the mean amount of money lost per...Ch. 3.1 - For each of the following situations, determine...Ch. 3.2 - The sum of the deviations about the mean always...Ch. 3.2 - The standard deviation is used in conjunction with...Ch. 3.2 - True or False: When comparing two populations, the...Ch. 3.2 - True or False: Chebyshevs Inequality applies to...Ch. 3.2 - In Problems 510, by hand, find the population...Ch. 3.2 - In Problems 510, by hand, find the population...Ch. 3.2 - In Problems 510, by hand, find the population...Ch. 3.2 - In Problems 510, by hand, find the population...Ch. 3.2 - In Problems 510, by hand, find the population...Ch. 3.2 - In Problems 510, by hand, find the population...Ch. 3.2 - Miles per Gallon The following data represent the...Ch. 3.2 - Exam Time The following data represent the amount...Ch. 3.2 - NW Concrete Mix A certain type of concrete mix is...Ch. 3.2 - Flight Time The following data represent the...Ch. 3.2 - Which histogram depicts a higher standard...Ch. 3.2 - Match the histograms in the next column to the...Ch. 3.2 - Exam Scores The following data represent exam...Ch. 3.2 - pH in Water The acidity or alkalinity of a...Ch. 3.2 - NW Pulse Rates The data on the following page...Ch. 3.2 - Travel Time The following data represent the...Ch. 3.2 - A Fish Story Ethan and Drew went on a 10-day...Ch. 3.2 - Prob. 22AYUCh. 3.2 - The Empirical Rule The following data represent...Ch. 3.2 - The Empirical Rule The following data represent...Ch. 3.2 - Prob. 25AYUCh. 3.2 - Prob. 26AYUCh. 3.2 - Prob. 27AYUCh. 3.2 - Temperatures It is well known that San Diego has...Ch. 3.2 - NW The Empirical Rule The StanfordBinet...Ch. 3.2 - The Empirical Rule SAT Math scores have a...Ch. 3.2 - The Empirical Rule The weight, in grams, of the...Ch. 3.2 - The Empirical Rule The distribution of the length...Ch. 3.2 - Which Professor Suppose Professor Alpha and...Ch. 3.2 - Larry Summers Lawrence Summers (former Secretary...Ch. 3.2 - NW Chebyshevs Inequality In December 2014, the...Ch. 3.2 - Chebyshevs Inequality According to the U.S. Census...Ch. 3.2 - Prob. 37AYUCh. 3.2 - Linear Transformations Benjamin owns a small...Ch. 3.2 - Prob. 39AYUCh. 3.2 - Prob. 40AYUCh. 3.2 - Prob. 41AYUCh. 3.2 - Blocking and Variability Blocking refers to the...Ch. 3.2 - Prob. 43AYUCh. 3.2 - Prob. 44AYUCh. 3.2 - Prob. 45AYUCh. 3.2 - More Spread? The data set on the left represents...Ch. 3.2 - Prob. 47AYUCh. 3.2 - Prob. 48AYUCh. 3.2 - Prob. 49AYUCh. 3.2 - What is meant by the phrase degrees of freedom as...Ch. 3.2 - Prob. 51AYUCh. 3.2 - Prob. 52AYUCh. 3.2 - What makes the range less desirable than the...Ch. 3.2 - Prob. 54AYUCh. 3.2 - Prob. 55AYUCh. 3.2 - Prob. 56AYUCh. 3.2 - Prob. 57AYUCh. 3.2 - Prob. 59AYUCh. 3.3 - NW Savings Recently, a random sample of 2534 year...Ch. 3.3 - Square Footage of Housing The frequency...Ch. 3.3 - Household Winter Temperature Often, frequency...Ch. 3.3 - Living in Poverty (See Problem 3.) The following...Ch. 3.3 - Multiple Births The following data represent the...Ch. 3.3 - Birth Weight The following frequency distribution...Ch. 3.3 - Cigarette Tax Rates Use the frequency distribution...Ch. 3.3 - Dividend Yield Use the frequency distribution...Ch. 3.3 - NW Grade-Point Average Marissa has just completed...Ch. 3.3 - Computing Class Average In Marissas calculus...Ch. 3.3 - Mixed Chocolates Michael and Kevin want to buy...Ch. 3.3 - Nut Mix Michael and Kevin return to the candy...Ch. 3.3 - Population The data represent the male and female...Ch. 3.3 - Age of Mother The following data represent the age...Ch. 3.3 - Approximate the median of the frequency...Ch. 3.3 - Prob. 16AYUCh. 3.3 - Prob. 17AYUCh. 3.3 - Determine the modal class of the frequency...Ch. 3.4 - The _____ represents the number of standard...Ch. 3.4 - The _____ _____ of a data set is a value such that...Ch. 3.4 - _____ divide data sets into fourths.Ch. 3.4 - Prob. 4AYUCh. 3.4 - Prob. 5AYUCh. 3.4 - Prob. 6AYUCh. 3.4 - Men versus Women The average 20- to 29-year-old...Ch. 3.4 - Prob. 8AYUCh. 3.4 - ERA Champions In 2014, Clayton Kershaw of the Los...Ch. 3.4 - Batting Champions The highest batting average ever...Ch. 3.4 - Prob. 11AYUCh. 3.4 - Triathlon Roberto finishes a triathlon (750-meter...Ch. 3.4 - School Admissions A highly selective boarding...Ch. 3.4 - Quality Control A manufacturer of bolts has a...Ch. 3.4 - Prob. 15AYUCh. 3.4 - You Explain It! Percentiles Explain the meaning of...Ch. 3.4 - You Explain It! Quartiles Violent crimes include...Ch. 3.4 - You Explain It! Quartiles One variable that is...Ch. 3.4 - Ogives and Percentiles The following graph is an...Ch. 3.4 - Ogives and Percentiles The following graph is an...Ch. 3.4 - NW SMART Car The data on the following page...Ch. 3.4 - Hemoglobin in Cats The following data represent...Ch. 3.4 - Rate of Return of Google The following data...Ch. 3.4 - CO2 Emissions The following data represent the...Ch. 3.4 - Fraud Detection As part of its Customers First...Ch. 3.4 - Stolen Credit Card A credit card company has a...Ch. 3.4 - Student Survey of Income A survey of 50 randomly...Ch. 3.4 - Student Survey of Entertainment Spending A survey...Ch. 3.4 - Prob. 29AYUCh. 3.4 - Travel Time Use the results of Problem 22 in...Ch. 3.4 - Fraud Detection Revisited Use the fraud-detection...Ch. 3.4 - Write a paragraph that explains the meaning of...Ch. 3.4 - Suppose you received the highest score on an exam....Ch. 3.4 - Prob. 34AYUCh. 3.4 - Prob. 35AYUCh. 3.4 - Prob. 36AYUCh. 3.4 - Prob. 37AYUCh. 3.4 - Prob. 38AYUCh. 3.4 - Prob. 39AYUCh. 3.5 - What does the five-number summary consist of?Ch. 3.5 - In a boxplot, if the median is to the left of the...Ch. 3.5 - Prob. 3AYUCh. 3.5 - In Problems 3 and 4, (a) identify the shape of the...Ch. 3.5 - Use the side-by-side boxplots shown to answer the...Ch. 3.5 - Use the side-by-side boxplots shown to answer the...Ch. 3.5 - Exam Scores After giving a statistics exam,...Ch. 3.5 - Prob. 8AYUCh. 3.5 - Prob. 9AYUCh. 3.5 - Carpoolers The following data represent the...Ch. 3.5 - NW Age of Mother at Birth The data below represent...Ch. 3.5 - Prob. 12AYUCh. 3.5 - Prob. 13AYUCh. 3.5 - Prob. 14AYUCh. 3.5 - Prob. 15AYUCh. 3.5 - Prob. 16AYUCh. 3.5 - Putting It Together: Earthquakes Go to...Ch. 3.5 - Putting It Together: Paternal Smoking It is...Ch. 3.5 - Retain Your Knowledge: Decision Making and Hunger...Ch. 3.5 - Prob. 20AYUCh. 3.5 - Prob. 21AYUCh. 3 - Muzzle Velocity The following data represent the...Ch. 3 - Price of Chevy Cobalts The following data...Ch. 3 - Chief Justices The following data represent the...Ch. 3 - Number of Tickets Issued As part of a statistics...Ch. 3 - Chebyshevs Inequality and the Empirical Rule...Ch. 3 - Prob. 6RECh. 3 - Weighted Mean Michael has just completed his first...Ch. 3 - Weights of Males versus Females According to the...Ch. 3 - Halladay No-No On October 6, 2010, Roy Halladay of...Ch. 3 - Presidential Inaugural Addresses Ever wonder how...Ch. 3 - You Explain It! Percentiles According to the...Ch. 3 - Skinfold Thickness Procedure One method of...Ch. 3 - The following data represent the amount of time...Ch. 3 - The Federal Bureau of Investigation classifies...Ch. 3 - Determine the range of the homework data from...Ch. 3 - a. Determine the standard deviation of the...Ch. 3 - In a random sample of 250 toner cartridges, the...Ch. 3 - The following data represent the length of time...Ch. 3 - Prob. 7CTCh. 3 - An engineer is studying bearing failures for two...Ch. 3 - The following data represent the weights (in...Ch. 3 - Armando is filling out a college application that...Ch. 3 - According to the National Center for Health...Ch. 3 - Prob. 12CTCh. 3 - Answer the following based on the histograms shown...Ch. 3 - Explain how the standard deviation measures...Ch. 3 - Generate a data set consisting of the length of...Ch. 3 - Prob. 2CSCh. 3 - Prob. 3CS
Knowledge Booster


Learn more about
Need a deep-dive on the concept behind this application? Look no further. Learn more about this topic, statistics and related others by exploring similar questions and additional content below.Similar questions
- Suppose that you take a sample of 100 from a population that contains 45 percent Democrats. What sample size condition do you need to check here (if any)?What’s the standard error of ^P?Compare the standard errors of ^p n=100 for ,n=1000 , n=10,000, and comment.arrow_forwardSuppose that a class’s test scores have a mean of 80 and standard deviation of 5. You choose 25 students from the class. What’s the chance that the group’s average test score is more than 82?arrow_forwardSuppose that you collect data on 10 products and check their weights. The average should be 10 ounces, but your sample mean is 9 ounces with standard deviation 2 ounces. Find the standard score.What percentile is the standard score found in part a of this question closest to?Suppose that the mean really is 10 ounces. Do you find these results unusual? Use probabilities to explain.arrow_forward
- Suppose that you want to sample expensive computer chips, but you can have only n=3 of them. Should you continue the experiment?arrow_forwardSuppose that studies claim that 40 percent of cellphone owners use their phones in the car while driving. What’s the chance that more than 425 out of a random sample of 1,000 cellphone owners say they use their phones while driving?arrow_forwardSuppose that the average length of stay in Europe for American tourists is 17 days, with standard deviation 4.5. You choose a random sample of 16 American tourists. The sample of 16 stay an average of 18.5 days or more. What’s the chance of that happening?arrow_forward
- How do you recognize that a statistical problem requires you to use the CLT? Think of one or two clues you can look for. (Assume quantitative data.)arrow_forwardSuppose that you take a sample of 100 from a skewed population with mean 50 and standard deviation 15. What sample size condition do you need to check here (if any)?What’s the shape and center of the sampling distribution for ?What’s the standard error?arrow_forwardQuestion 3 The following stem-and-leaf displays the weekly salary of employees at this firm. Stem-and-Leaf Display Leaf Unit = 10.0 N=x 5 3 00123 12 4 0125888 (y) 5 11234456777 z 6 13568 5 7 154 2 8 46 i. Determine the value of x, y and z. [3] ii. What is the value of the median? [2] iii. Find the mode of this data set. iv. Calculate the range [1] [2]arrow_forward
- Let Y be a continuous RV with PDF otherwise Find the CDF, Fry), of Y . Find an expression for pth, p € (0, 1), quantile of the distribution. Find E(Y) and V(Y). Find E(-2Y + 1) and V(-3Y - 2). Find E(Y3).arrow_forwardLet X be a continuous RV with CDF Find P(X < 0), P(-1 < X < 1) and P(0.5 < X). Based on your answers to the above questions, what is the median of the distribu-tion? Why Find the PDF, fx (x), of X.arrow_forwardA survey of 581 citizens found that 313 of them favor a new bill introduced by the city. We want to find a 95% confidence interval for the true proportion of the population who favor the bill. What is the lower limit of the interval? Enter the result as a decimal rounded to 3 decimal digits. Your Answer:arrow_forward
arrow_back_ios
SEE MORE QUESTIONS
arrow_forward_ios
Recommended textbooks for you
 Big Ideas Math A Bridge To Success Algebra 1: Stu...AlgebraISBN:9781680331141Author:HOUGHTON MIFFLIN HARCOURTPublisher:Houghton Mifflin Harcourt
 Glencoe Algebra 1, Student Edition, 9780079039897...AlgebraISBN:9780079039897Author:CarterPublisher:McGraw Hill
 Holt Mcdougal Larson Pre-algebra: Student Edition...AlgebraISBN:9780547587776Author:HOLT MCDOUGALPublisher:HOLT MCDOUGAL
Big Ideas Math A Bridge To Success Algebra 1: Stu...
Algebra
ISBN:9781680331141
Author:HOUGHTON MIFFLIN HARCOURT
Publisher:Houghton Mifflin Harcourt
Glencoe Algebra 1, Student Edition, 9780079039897...
Algebra
ISBN:9780079039897
Author:Carter
Publisher:McGraw Hill
Holt Mcdougal Larson Pre-algebra: Student Edition...
Algebra
ISBN:9780547587776
Author:HOLT MCDOUGAL
Publisher:HOLT MCDOUGAL
Hypothesis Testing using Confidence Interval Approach; Author: BUM2413 Applied Statistics UMP;https://www.youtube.com/watch?v=Hq1l3e9pLyY;License: Standard YouTube License, CC-BY
Hypothesis Testing - Difference of Two Means - Student's -Distribution & Normal Distribution; Author: The Organic Chemistry Tutor;https://www.youtube.com/watch?v=UcZwyzwWU7o;License: Standard Youtube License