
Fundamentals of Statistics (5th Edition)
5th Edition
ISBN: 9780134508306
Author: Michael Sullivan III
Publisher: PEARSON
expand_more
expand_more
format_list_bulleted
Videos
Textbook Question
Chapter 3, Problem 1CT
The following data represent the amount of time (in minutes) a random sample of eight students enrolled in Sullivan’s Intermediate Algebra course spent on the homework from Section 4.5, Factoring Polynomials.
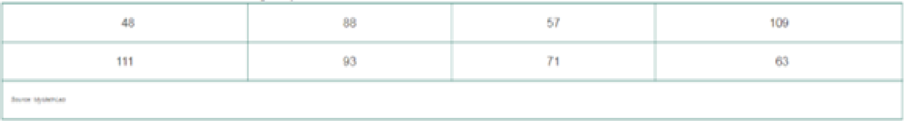
- a. Determine the
mean amount of time spent doing Section 4.5 homework. - b. Determine the
median amount of time spent doing Section 4.5 homework. - c. Suppose the observation 109 minutes is incorrectly recorded as 1009 minutes. Recompute the mean and the median. What do you notice? What property of the median does this illustrate?
Expert Solution & Answer
Want to see the full answer?
Check out a sample textbook solution
Students have asked these similar questions
Business
Why researchers are interested in describing measures of the center and measures of variation of a data set?
WHAT IS THE SOLUTION?
Chapter 3 Solutions
Fundamentals of Statistics (5th Edition)
Ch. 3.1 - What does it mean if a statistic is resistant?Ch. 3.1 - In the 2014 Current Population Survey conducted by...Ch. 3.1 - The U.S. Department of Housing and Urban...Ch. 3.1 - A histogram of a set of data indicates that the...Ch. 3.1 - If a data set contains 10,000 values arranged in...Ch. 3.1 - True or False: A data set will always have exactly...Ch. 3.1 - In Problems 710, find the population mean or...Ch. 3.1 - In Problems 710, find the population mean or...Ch. 3.1 - In Problems 710, find the population mean or...Ch. 3.1 - In Problems 710, find the population mean or...
Ch. 3.1 - For Super Bowl XLVII, there were 82,566 tickets...Ch. 3.1 - The median for the given set of six ordered data...Ch. 3.1 - Miles per Gallon The following data represent the...Ch. 3.1 - Exam Time The following data represent the amount...Ch. 3.1 - NW Concrete Mix A certain type of concrete mix is...Ch. 3.1 - Flight Time The following data represent the...Ch. 3.1 - For each of the three histograms shown, determine...Ch. 3.1 - Match the histograms shown to the summary...Ch. 3.1 - Exam Scores The data in the next column represent...Ch. 3.1 - pH in Water The acidity or alkalinity of a...Ch. 3.1 - NW Pulse Rates The following data represent the...Ch. 3.1 - Travel Time The data represent the travel time (in...Ch. 3.1 - NW Connection Time A histogram of the connection...Ch. 3.1 - Journal Costs A histogram of the annual...Ch. 3.1 - MMs The following data represent the weights (in...Ch. 3.1 - Old Faithful We have all heard of the Old Faithful...Ch. 3.1 - Hours Working A random sample of 25 college...Ch. 3.1 - Prob. 28AYUCh. 3.1 - NW Political Views A sample of 30 registered...Ch. 3.1 - Prob. 30AYUCh. 3.1 - Prob. 31AYUCh. 3.1 - Mr. Zuro finds the mean height of all 14 students...Ch. 3.1 - Missing Exam Grade A professor has recorded exam...Ch. 3.1 - Prob. 34AYUCh. 3.1 - Blood Alcohol Concentration Go to...Ch. 3.1 - Prob. 36AYUCh. 3.1 - Linear Transformations Benjamin owns a small...Ch. 3.1 - Linear Transformations Use the five test scores of...Ch. 3.1 - Trimmed Mean Another measure of central tendency...Ch. 3.1 - Prob. 40AYUCh. 3.1 - Putting It Together: Shape, Mean and Median As...Ch. 3.1 - FICO Scores The Fair Isaacs Corporation has...Ch. 3.1 - Why is the median resistant, but the mean is not?Ch. 3.1 - Prob. 44AYUCh. 3.1 - Net Worth According to a Credit Suisse Survey, the...Ch. 3.1 - Prob. 46AYUCh. 3.1 - In January 2016, the mean amount of money lost per...Ch. 3.1 - For each of the following situations, determine...Ch. 3.2 - The sum of the deviations about the mean always...Ch. 3.2 - The standard deviation is used in conjunction with...Ch. 3.2 - True or False: When comparing two populations, the...Ch. 3.2 - True or False: Chebyshevs Inequality applies to...Ch. 3.2 - In Problems 510, by hand, find the population...Ch. 3.2 - In Problems 510, by hand, find the population...Ch. 3.2 - In Problems 510, by hand, find the population...Ch. 3.2 - In Problems 510, by hand, find the population...Ch. 3.2 - In Problems 510, by hand, find the population...Ch. 3.2 - In Problems 510, by hand, find the population...Ch. 3.2 - Miles per Gallon The following data represent the...Ch. 3.2 - Exam Time The following data represent the amount...Ch. 3.2 - NW Concrete Mix A certain type of concrete mix is...Ch. 3.2 - Flight Time The following data represent the...Ch. 3.2 - Which histogram depicts a higher standard...Ch. 3.2 - Match the histograms in the next column to the...Ch. 3.2 - Exam Scores The following data represent exam...Ch. 3.2 - pH in Water The acidity or alkalinity of a...Ch. 3.2 - NW Pulse Rates The data on the following page...Ch. 3.2 - Travel Time The following data represent the...Ch. 3.2 - A Fish Story Ethan and Drew went on a 10-day...Ch. 3.2 - Prob. 22AYUCh. 3.2 - The Empirical Rule The following data represent...Ch. 3.2 - The Empirical Rule The following data represent...Ch. 3.2 - Prob. 25AYUCh. 3.2 - Prob. 26AYUCh. 3.2 - Prob. 27AYUCh. 3.2 - Temperatures It is well known that San Diego has...Ch. 3.2 - NW The Empirical Rule The StanfordBinet...Ch. 3.2 - The Empirical Rule SAT Math scores have a...Ch. 3.2 - The Empirical Rule The weight, in grams, of the...Ch. 3.2 - The Empirical Rule The distribution of the length...Ch. 3.2 - Which Professor Suppose Professor Alpha and...Ch. 3.2 - Larry Summers Lawrence Summers (former Secretary...Ch. 3.2 - NW Chebyshevs Inequality In December 2014, the...Ch. 3.2 - Chebyshevs Inequality According to the U.S. Census...Ch. 3.2 - Prob. 37AYUCh. 3.2 - Linear Transformations Benjamin owns a small...Ch. 3.2 - Prob. 39AYUCh. 3.2 - Prob. 40AYUCh. 3.2 - Prob. 41AYUCh. 3.2 - Blocking and Variability Blocking refers to the...Ch. 3.2 - Prob. 43AYUCh. 3.2 - Prob. 44AYUCh. 3.2 - Prob. 45AYUCh. 3.2 - More Spread? The data set on the left represents...Ch. 3.2 - Prob. 47AYUCh. 3.2 - Prob. 48AYUCh. 3.2 - Prob. 49AYUCh. 3.2 - What is meant by the phrase degrees of freedom as...Ch. 3.2 - Prob. 51AYUCh. 3.2 - Prob. 52AYUCh. 3.2 - What makes the range less desirable than the...Ch. 3.2 - Prob. 54AYUCh. 3.2 - Prob. 55AYUCh. 3.2 - Prob. 56AYUCh. 3.2 - Prob. 57AYUCh. 3.2 - Prob. 59AYUCh. 3.3 - NW Savings Recently, a random sample of 2534 year...Ch. 3.3 - Square Footage of Housing The frequency...Ch. 3.3 - Household Winter Temperature Often, frequency...Ch. 3.3 - Living in Poverty (See Problem 3.) The following...Ch. 3.3 - Multiple Births The following data represent the...Ch. 3.3 - Birth Weight The following frequency distribution...Ch. 3.3 - Cigarette Tax Rates Use the frequency distribution...Ch. 3.3 - Dividend Yield Use the frequency distribution...Ch. 3.3 - NW Grade-Point Average Marissa has just completed...Ch. 3.3 - Computing Class Average In Marissas calculus...Ch. 3.3 - Mixed Chocolates Michael and Kevin want to buy...Ch. 3.3 - Nut Mix Michael and Kevin return to the candy...Ch. 3.3 - Population The data represent the male and female...Ch. 3.3 - Age of Mother The following data represent the age...Ch. 3.3 - Approximate the median of the frequency...Ch. 3.3 - Prob. 16AYUCh. 3.3 - Prob. 17AYUCh. 3.3 - Determine the modal class of the frequency...Ch. 3.4 - The _____ represents the number of standard...Ch. 3.4 - The _____ _____ of a data set is a value such that...Ch. 3.4 - _____ divide data sets into fourths.Ch. 3.4 - Prob. 4AYUCh. 3.4 - Prob. 5AYUCh. 3.4 - Prob. 6AYUCh. 3.4 - Men versus Women The average 20- to 29-year-old...Ch. 3.4 - Prob. 8AYUCh. 3.4 - ERA Champions In 2014, Clayton Kershaw of the Los...Ch. 3.4 - Batting Champions The highest batting average ever...Ch. 3.4 - Prob. 11AYUCh. 3.4 - Triathlon Roberto finishes a triathlon (750-meter...Ch. 3.4 - School Admissions A highly selective boarding...Ch. 3.4 - Quality Control A manufacturer of bolts has a...Ch. 3.4 - Prob. 15AYUCh. 3.4 - You Explain It! Percentiles Explain the meaning of...Ch. 3.4 - You Explain It! Quartiles Violent crimes include...Ch. 3.4 - You Explain It! Quartiles One variable that is...Ch. 3.4 - Ogives and Percentiles The following graph is an...Ch. 3.4 - Ogives and Percentiles The following graph is an...Ch. 3.4 - NW SMART Car The data on the following page...Ch. 3.4 - Hemoglobin in Cats The following data represent...Ch. 3.4 - Rate of Return of Google The following data...Ch. 3.4 - CO2 Emissions The following data represent the...Ch. 3.4 - Fraud Detection As part of its Customers First...Ch. 3.4 - Stolen Credit Card A credit card company has a...Ch. 3.4 - Student Survey of Income A survey of 50 randomly...Ch. 3.4 - Student Survey of Entertainment Spending A survey...Ch. 3.4 - Prob. 29AYUCh. 3.4 - Travel Time Use the results of Problem 22 in...Ch. 3.4 - Fraud Detection Revisited Use the fraud-detection...Ch. 3.4 - Write a paragraph that explains the meaning of...Ch. 3.4 - Suppose you received the highest score on an exam....Ch. 3.4 - Prob. 34AYUCh. 3.4 - Prob. 35AYUCh. 3.4 - Prob. 36AYUCh. 3.4 - Prob. 37AYUCh. 3.4 - Prob. 38AYUCh. 3.4 - Prob. 39AYUCh. 3.5 - What does the five-number summary consist of?Ch. 3.5 - In a boxplot, if the median is to the left of the...Ch. 3.5 - Prob. 3AYUCh. 3.5 - In Problems 3 and 4, (a) identify the shape of the...Ch. 3.5 - Use the side-by-side boxplots shown to answer the...Ch. 3.5 - Use the side-by-side boxplots shown to answer the...Ch. 3.5 - Exam Scores After giving a statistics exam,...Ch. 3.5 - Prob. 8AYUCh. 3.5 - Prob. 9AYUCh. 3.5 - Carpoolers The following data represent the...Ch. 3.5 - NW Age of Mother at Birth The data below represent...Ch. 3.5 - Prob. 12AYUCh. 3.5 - Prob. 13AYUCh. 3.5 - Prob. 14AYUCh. 3.5 - Prob. 15AYUCh. 3.5 - Prob. 16AYUCh. 3.5 - Putting It Together: Earthquakes Go to...Ch. 3.5 - Putting It Together: Paternal Smoking It is...Ch. 3.5 - Retain Your Knowledge: Decision Making and Hunger...Ch. 3.5 - Prob. 20AYUCh. 3.5 - Prob. 21AYUCh. 3 - Muzzle Velocity The following data represent the...Ch. 3 - Price of Chevy Cobalts The following data...Ch. 3 - Chief Justices The following data represent the...Ch. 3 - Number of Tickets Issued As part of a statistics...Ch. 3 - Chebyshevs Inequality and the Empirical Rule...Ch. 3 - Prob. 6RECh. 3 - Weighted Mean Michael has just completed his first...Ch. 3 - Weights of Males versus Females According to the...Ch. 3 - Halladay No-No On October 6, 2010, Roy Halladay of...Ch. 3 - Presidential Inaugural Addresses Ever wonder how...Ch. 3 - You Explain It! Percentiles According to the...Ch. 3 - Skinfold Thickness Procedure One method of...Ch. 3 - The following data represent the amount of time...Ch. 3 - The Federal Bureau of Investigation classifies...Ch. 3 - Determine the range of the homework data from...Ch. 3 - a. Determine the standard deviation of the...Ch. 3 - In a random sample of 250 toner cartridges, the...Ch. 3 - The following data represent the length of time...Ch. 3 - Prob. 7CTCh. 3 - An engineer is studying bearing failures for two...Ch. 3 - The following data represent the weights (in...Ch. 3 - Armando is filling out a college application that...Ch. 3 - According to the National Center for Health...Ch. 3 - Prob. 12CTCh. 3 - Answer the following based on the histograms shown...Ch. 3 - Explain how the standard deviation measures...Ch. 3 - Generate a data set consisting of the length of...Ch. 3 - Prob. 2CSCh. 3 - Prob. 3CS
Knowledge Booster


Learn more about
Need a deep-dive on the concept behind this application? Look no further. Learn more about this topic, statistics and related others by exploring similar questions and additional content below.Similar questions
- The following ordered data list shows the data speeds for cell phones used by a telephone company at an airport: A. Calculate the Measures of Central Tendency from the ungrouped data list. B. Group the data in an appropriate frequency table. C. Calculate the Measures of Central Tendency using the table in point B. 0.8 1.4 1.8 1.9 3.2 3.6 4.5 4.5 4.6 6.2 6.5 7.7 7.9 9.9 10.2 10.3 10.9 11.1 11.1 11.6 11.8 12.0 13.1 13.5 13.7 14.1 14.2 14.7 15.0 15.1 15.5 15.8 16.0 17.5 18.2 20.2 21.1 21.5 22.2 22.4 23.1 24.5 25.7 28.5 34.6 38.5 43.0 55.6 71.3 77.8arrow_forwardII Consider the following data matrix X: X1 X2 0.5 0.4 0.2 0.5 0.5 0.5 10.3 10 10.1 10.4 10.1 10.5 What will the resulting clusters be when using the k-Means method with k = 2. In your own words, explain why this result is indeed expected, i.e. why this clustering minimises the ESS map.arrow_forwardwhy the answer is 3 and 10?arrow_forward
- PS 9 Two films are shown on screen A and screen B at a cinema each evening. The numbers of people viewing the films on 12 consecutive evenings are shown in the back-to-back stem-and-leaf diagram. Screen A (12) Screen B (12) 8 037 34 7 6 4 0 534 74 1645678 92 71689 Key: 116|4 represents 61 viewers for A and 64 viewers for B A second stem-and-leaf diagram (with rows of the same width as the previous diagram) is drawn showing the total number of people viewing films at the cinema on each of these 12 evenings. Find the least and greatest possible number of rows that this second diagram could have. TIP On the evening when 30 people viewed films on screen A, there could have been as few as 37 or as many as 79 people viewing films on screen B.arrow_forwardQ.2.4 There are twelve (12) teams participating in a pub quiz. What is the probability of correctly predicting the top three teams at the end of the competition, in the correct order? Give your final answer as a fraction in its simplest form.arrow_forwardThe table below indicates the number of years of experience of a sample of employees who work on a particular production line and the corresponding number of units of a good that each employee produced last month. Years of Experience (x) Number of Goods (y) 11 63 5 57 1 48 4 54 5 45 3 51 Q.1.1 By completing the table below and then applying the relevant formulae, determine the line of best fit for this bivariate data set. Do NOT change the units for the variables. X y X2 xy Ex= Ey= EX2 EXY= Q.1.2 Estimate the number of units of the good that would have been produced last month by an employee with 8 years of experience. Q.1.3 Using your calculator, determine the coefficient of correlation for the data set. Interpret your answer. Q.1.4 Compute the coefficient of determination for the data set. Interpret your answer.arrow_forward
- Can you answer this question for mearrow_forwardTechniques QUAT6221 2025 PT B... TM Tabudi Maphoru Activities Assessments Class Progress lIE Library • Help v The table below shows the prices (R) and quantities (kg) of rice, meat and potatoes items bought during 2013 and 2014: 2013 2014 P1Qo PoQo Q1Po P1Q1 Price Ро Quantity Qo Price P1 Quantity Q1 Rice 7 80 6 70 480 560 490 420 Meat 30 50 35 60 1 750 1 500 1 800 2 100 Potatoes 3 100 3 100 300 300 300 300 TOTAL 40 230 44 230 2 530 2 360 2 590 2 820 Instructions: 1 Corall dawn to tha bottom of thir ceraan urina se se tha haca nariad in archerca antarand cubmit Q Search ENG US 口X 2025/05arrow_forwardThe table below indicates the number of years of experience of a sample of employees who work on a particular production line and the corresponding number of units of a good that each employee produced last month. Years of Experience (x) Number of Goods (y) 11 63 5 57 1 48 4 54 45 3 51 Q.1.1 By completing the table below and then applying the relevant formulae, determine the line of best fit for this bivariate data set. Do NOT change the units for the variables. X y X2 xy Ex= Ey= EX2 EXY= Q.1.2 Estimate the number of units of the good that would have been produced last month by an employee with 8 years of experience. Q.1.3 Using your calculator, determine the coefficient of correlation for the data set. Interpret your answer. Q.1.4 Compute the coefficient of determination for the data set. Interpret your answer.arrow_forward
- Q.3.2 A sample of consumers was asked to name their favourite fruit. The results regarding the popularity of the different fruits are given in the following table. Type of Fruit Number of Consumers Banana 25 Apple 20 Orange 5 TOTAL 50 Draw a bar chart to graphically illustrate the results given in the table.arrow_forwardQ.2.3 The probability that a randomly selected employee of Company Z is female is 0.75. The probability that an employee of the same company works in the Production department, given that the employee is female, is 0.25. What is the probability that a randomly selected employee of the company will be female and will work in the Production department? Q.2.4 There are twelve (12) teams participating in a pub quiz. What is the probability of correctly predicting the top three teams at the end of the competition, in the correct order? Give your final answer as a fraction in its simplest form.arrow_forwardQ.2.1 A bag contains 13 red and 9 green marbles. You are asked to select two (2) marbles from the bag. The first marble selected will not be placed back into the bag. Q.2.1.1 Construct a probability tree to indicate the various possible outcomes and their probabilities (as fractions). Q.2.1.2 What is the probability that the two selected marbles will be the same colour? Q.2.2 The following contingency table gives the results of a sample survey of South African male and female respondents with regard to their preferred brand of sports watch: PREFERRED BRAND OF SPORTS WATCH Samsung Apple Garmin TOTAL No. of Females 30 100 40 170 No. of Males 75 125 80 280 TOTAL 105 225 120 450 Q.2.2.1 What is the probability of randomly selecting a respondent from the sample who prefers Garmin? Q.2.2.2 What is the probability of randomly selecting a respondent from the sample who is not female? Q.2.2.3 What is the probability of randomly…arrow_forward
arrow_back_ios
SEE MORE QUESTIONS
arrow_forward_ios
Recommended textbooks for you
 Holt Mcdougal Larson Pre-algebra: Student Edition...AlgebraISBN:9780547587776Author:HOLT MCDOUGALPublisher:HOLT MCDOUGAL
 Functions and Change: A Modeling Approach to Coll...AlgebraISBN:9781337111348Author:Bruce Crauder, Benny Evans, Alan NoellPublisher:Cengage Learning
 College Algebra (MindTap Course List)AlgebraISBN:9781305652231Author:R. David Gustafson, Jeff HughesPublisher:Cengage Learning
 Big Ideas Math A Bridge To Success Algebra 1: Stu...AlgebraISBN:9781680331141Author:HOUGHTON MIFFLIN HARCOURTPublisher:Houghton Mifflin Harcourt
 Glencoe Algebra 1, Student Edition, 9780079039897...AlgebraISBN:9780079039897Author:CarterPublisher:McGraw Hill
Holt Mcdougal Larson Pre-algebra: Student Edition...
Algebra
ISBN:9780547587776
Author:HOLT MCDOUGAL
Publisher:HOLT MCDOUGAL
Functions and Change: A Modeling Approach to Coll...
Algebra
ISBN:9781337111348
Author:Bruce Crauder, Benny Evans, Alan Noell
Publisher:Cengage Learning
College Algebra (MindTap Course List)
Algebra
ISBN:9781305652231
Author:R. David Gustafson, Jeff Hughes
Publisher:Cengage Learning
Big Ideas Math A Bridge To Success Algebra 1: Stu...
Algebra
ISBN:9781680331141
Author:HOUGHTON MIFFLIN HARCOURT
Publisher:Houghton Mifflin Harcourt
Glencoe Algebra 1, Student Edition, 9780079039897...
Algebra
ISBN:9780079039897
Author:Carter
Publisher:McGraw Hill
Hypothesis Testing using Confidence Interval Approach; Author: BUM2413 Applied Statistics UMP;https://www.youtube.com/watch?v=Hq1l3e9pLyY;License: Standard YouTube License, CC-BY
Hypothesis Testing - Difference of Two Means - Student's -Distribution & Normal Distribution; Author: The Organic Chemistry Tutor;https://www.youtube.com/watch?v=UcZwyzwWU7o;License: Standard Youtube License