
Essentials of Statistics (5th Edition)
5th Edition
ISBN: 9780321924599
Author: Mario F. Triola
Publisher: PEARSON
expand_more
expand_more
format_list_bulleted
Concept explainers
Videos
Textbook Question
Chapter 3.4, Problem 17BSC
Percentiles. In Exercises 17-20, use the following duration times (seconds) of 24 eruptions of the Old Faithful geyser in Yellowstone National Park. The duration times are sorted from lowest to highest. Find the percentile corresponding to the given time.
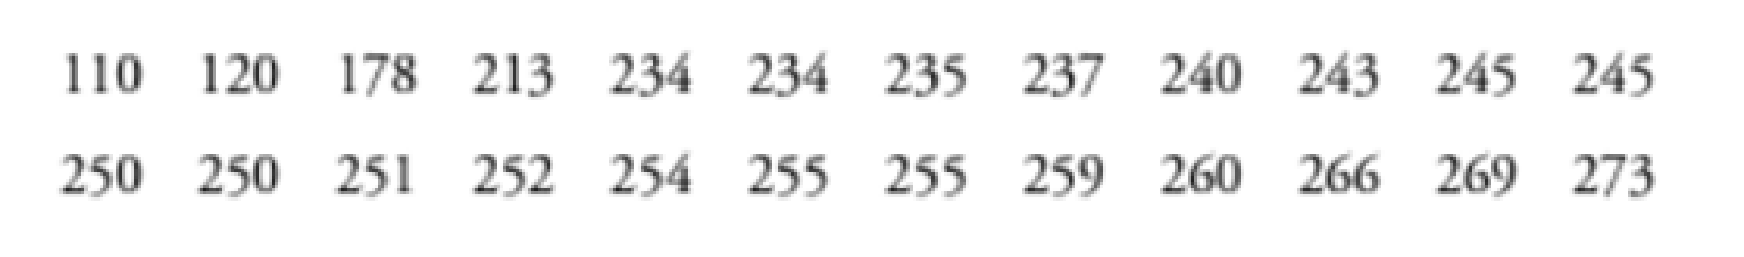
17. 213 sec
Expert Solution & Answer
Want to see the full answer?
Check out a sample textbook solution
Students have asked these similar questions
Elementary StatisticsBase on the same given data uploaded in module 4, will you conclude that the number of bathroom of houses is a significant factor for house sellprice? I your answer is affirmative, you need to explain how the number of bathroom influences the house price, using a post hoc procedure. (Please treat number of bathrooms as a categorical variable in this analysis)Base on the same given data, conduct an analysis for the variable sellprice to see if sale price is influenced by living area. Summarize your finding including all regular steps (learned in this module) for your method. Also, will you conclude that larger house corresponding to higher price (justify)?Each question need to include a spss or sas output.
Instructions:
You have to use SAS or SPSS to perform appropriate procedure: ANOVA or Regression based on the project data (provided in the module 4) and research question in the project file. Attach the computer output of all key steps (number) quoted in…
Elementary StatsBase on the given data uploaded in module 4, change the variable sale price into two categories: abovethe mean price or not; and change the living area into two categories: above the median living area ornot ( your two group should have close number of houses in each group). Using the resulting variables,will you conclude that larger house corresponding to higher price?Note: Need computer output, Ho and Ha, P and decision. If p is small, you need to explain what type ofdependency (association) we have using an appropriate pair of percentages.
Please include how to use the data in SPSS and interpretation of data.
An environmental research team is studying the daily rainfall (in millimeters) in a region over 100 days.
The data is grouped into the following histogram bins:
Rainfall Range (mm) Frequency
0-9.9
15
10 19.9
25
20-29.9
30
30-39.9
20
||40-49.9
10
a) If a random day is selected, what is the probability that the rainfall was at least 20 mm but less than 40
mm?
b) Estimate the mean daily rainfall, assuming the rainfall in each bin is uniformly distributed and the
midpoint of each bin represents the average rainfall for that range.
c) Construct the cumulative frequency distribution and determine the rainfall level below which 75% of the
days fall.
d) Calculate the estimated variance and standard deviation of the daily rainfall based on the histogram data.
Chapter 3 Solutions
Essentials of Statistics (5th Edition)
Ch. 3.2 - Employment Data listed below are results from the...Ch. 3.2 - Average The web site IncomeTaxList.com lists the...Ch. 3.2 - Median In an editorial, the Poughkeepsie Journal...Ch. 3.2 - Prob. 4BSCCh. 3.2 - In Exercises 5-20, find the (a) mean, (b) median,...Ch. 3.2 - In Exercises 5-20, find the (a) mean, (b) median,...Ch. 3.2 - In Exercises 5-20, find the (a) mean, (b) median,...Ch. 3.2 - Prob. 8BSCCh. 3.2 - In Exercises 5-20, find the (a) mean, (b) median,...Ch. 3.2 - Prob. 10BSC
Ch. 3.2 - In Exercises 5-20, find the (a) mean, (b) median,...Ch. 3.2 - In Exercises 5-20, find the (a) mean, (b) median,...Ch. 3.2 - In Exercises 5-20, find the (a) mean, (b) median,...Ch. 3.2 - Prob. 14BSCCh. 3.2 - In Exercises 5-20, find the (a) mean, (b) median,...Ch. 3.2 - In Exercises 5-20, find the (a) mean, (b) median,...Ch. 3.2 - In Exercises 5-20, find the (a) mean, (b) median,...Ch. 3.2 - Prob. 18BSCCh. 3.2 - In Exercises 5-20, find the (a) mean, (b) median,...Ch. 3.2 - In Exercises 5-20, find the (a) mean, (b) median,...Ch. 3.2 - In Exercises 21-24, find the mean and median for...Ch. 3.2 - In Exercises 21-24, find the mean and median for...Ch. 3.2 - Prob. 23BSCCh. 3.2 - In Exercises 21-24, find the mean and median for...Ch. 3.2 - Large Data Sots from Appendix B. In Exercises...Ch. 3.2 - Prob. 26BSCCh. 3.2 - Prob. 27BSCCh. 3.2 - Prob. 28BSCCh. 3.2 - Prob. 29BSCCh. 3.2 - In Exercises 29-32, find the mean of the data...Ch. 3.2 - Prob. 31BSCCh. 3.2 - In Exercises 29-32, find the mean of the data...Ch. 3.2 - Degrees of Freedom Carbon monoxide is measured in...Ch. 3.2 - Prob. 34BBCh. 3.2 - Trimmed Mean Because the mean is very sensitive to...Ch. 3.2 - Prob. 36BBCh. 3.2 - Prob. 37BBCh. 3.2 - Quadratic Mean The quadratic mean (or root mean...Ch. 3.2 - Prob. 39BBCh. 3.3 - Comparing Variation Which do you think has less...Ch. 3.3 - Correct Statements? Which of the following...Ch. 3.3 - Variation and Variance In statistics, how do the...Ch. 3.3 - Prob. 4BSCCh. 3.3 - In Exercises 5-20, find the range, variance, and...Ch. 3.3 - In Exercises 5-20, find the range, variance, and...Ch. 3.3 - Prob. 7BSCCh. 3.3 - In Exercises 5-20, find the range, variance, and...Ch. 3.3 - Prob. 9BSCCh. 3.3 - In Exercises 5-20, find the range, variance, and...Ch. 3.3 - Prob. 11BSCCh. 3.3 - Prob. 12BSCCh. 3.3 - Prob. 13BSCCh. 3.3 - In Exercises 5-20, find the range, variance, and...Ch. 3.3 - Prob. 15BSCCh. 3.3 - In Exercises 5-20, find the range, variance, and...Ch. 3.3 - In Exercises 5-20, find the range, variance, and...Ch. 3.3 - Prob. 18BSCCh. 3.3 - In Exercises 5-20, find the range, variance, and...Ch. 3.3 - In Exercises 5-20, find the range, variance, and...Ch. 3.3 - Prob. 21BSCCh. 3.3 - Prob. 22BSCCh. 3.3 - Prob. 23BSCCh. 3.3 - Prob. 24BSCCh. 3.3 - Prob. 25BSCCh. 3.3 - Prob. 26BSCCh. 3.3 - Prob. 27BSCCh. 3.3 - Prob. 28BSCCh. 3.3 - Prob. 29BSCCh. 3.3 - Estimating Standard Deviation with the Range Rule...Ch. 3.3 - Prob. 31BSCCh. 3.3 - Prob. 32BSCCh. 3.3 - Prob. 33BSCCh. 3.3 - Prob. 34BSCCh. 3.3 - Identifying Unusual Values with the Range Rule of...Ch. 3.3 - Prob. 36BSCCh. 3.3 - Prob. 37BSCCh. 3.3 - Finding Standard Deviation from a Frequency...Ch. 3.3 - Prob. 39BSCCh. 3.3 - Finding Standard Deviation from a Frequency...Ch. 3.3 - Prob. 41BSCCh. 3.3 - The Empirical Rule Based on Data Set 3 Body...Ch. 3.3 - Prob. 43BSCCh. 3.3 - Chebyshev's Theorem Based on Data Set 3 in...Ch. 3.3 - Why Divide by n 1? Let a population consist of...Ch. 3.3 - Prob. 46BBCh. 3.4 - z Scores James Madison, the fourth President of...Ch. 3.4 - Prob. 2BSCCh. 3.4 - Prob. 3BSCCh. 3.4 - Prob. 4BSCCh. 3.4 - Prob. 5BSCCh. 3.4 - Prob. 6BSCCh. 3.4 - Prob. 7BSCCh. 3.4 - Prob. 8BSCCh. 3.4 - Prob. 9BSCCh. 3.4 - Prob. 10BSCCh. 3.4 - Usual and Unusual Values.In Exercises 9-12,...Ch. 3.4 - Usual and Unusual Values.In Exercises 9-12,...Ch. 3.4 - Prob. 13BSCCh. 3.4 - Prob. 14BSCCh. 3.4 - Comparing Values.In Exercises 13-16, use z scores...Ch. 3.4 - Prob. 16BSCCh. 3.4 - Percentiles. In Exercises 17-20, use the following...Ch. 3.4 - Prob. 18BSCCh. 3.4 - Prob. 19BSCCh. 3.4 - Prob. 20BSCCh. 3.4 - Prob. 21BSCCh. 3.4 - Prob. 22BSCCh. 3.4 - Prob. 23BSCCh. 3.4 - Prob. 24BSCCh. 3.4 - Prob. 25BSCCh. 3.4 - Prob. 26BSCCh. 3.4 - Prob. 27BSCCh. 3.4 - Prob. 28BSCCh. 3.4 - Boxplots. In Exercises 29-32, use the given data...Ch. 3.4 - Prob. 30BSCCh. 3.4 - Prob. 31BSCCh. 3.4 - Boxplots. In Exercises 29-32, use the given data...Ch. 3.4 - Prob. 33BSCCh. 3.4 - Boxplots from Larger Data Sets In Appendix B. In...Ch. 3.4 - Prob. 35BSCCh. 3.4 - Boxplots from Larger Data Sets In Appendix B. In...Ch. 3.4 - Prob. 37BBCh. 3.4 - Prob. 38BBCh. 3 - Find the mean of these times that American...Ch. 3 - What is the median of the sample values listed in...Ch. 3 - Prob. 3CQQCh. 3 - The standard deviation of the sample values in...Ch. 3 - The taxi-in times for 48 flights that landed in...Ch. 3 - You plan to investigate the variation of taxi-in...Ch. 3 - Consider a sample taken from the population of all...Ch. 3 - Consider a sample taken from the population of all...Ch. 3 - Approximately what percentage of taxi-in times is...Ch. 3 - Prob. 10CQQCh. 3 - Ergonomics When designing an eye-recognition...Ch. 3 - z Score Using the sample data from Exercise 1,...Ch. 3 - Boxplot Using the same standing heights listed in...Ch. 3 - Prob. 4RECh. 3 - Prob. 5RECh. 3 - Aircraft Design Engineers designing overhead bin...Ch. 3 - Prob. 9RECh. 3 - Moan or Median? A statistics class with 40...Ch. 3 - Designing Gloves An engineer is designing a...Ch. 3 - Frequency Distribution Use the hand lengths in...Ch. 3 - Histogram Use the frequency distribution from...Ch. 3 - Stemplot Use the hand lengths from Exercise 1 to...Ch. 3 - Descriptive Statistics Use the hand lengths in...Ch. 3 - Normal Distribution Instead of using the hand...Ch. 3 - Sampling Shortly after the World Trade Center...Ch. 3 - Prob. 8CRE
Knowledge Booster


Learn more about
Need a deep-dive on the concept behind this application? Look no further. Learn more about this topic, statistics and related others by exploring similar questions and additional content below.Similar questions
- An electronics company manufactures batches of n circuit boards. Before a batch is approved for shipment, m boards are randomly selected from the batch and tested. The batch is rejected if more than d boards in the sample are found to be faulty. a) A batch actually contains six faulty circuit boards. Find the probability that the batch is rejected when n = 20, m = 5, and d = 1. b) A batch actually contains nine faulty circuit boards. Find the probability that the batch is rejected when n = 30, m = 10, and d = 1.arrow_forwardTwenty-eight applicants interested in working for the Food Stamp program took an examination designed to measure their aptitude for social work. A stem-and-leaf plot of the 28 scores appears below, where the first column is the count per branch, the second column is the stem value, and the remaining digits are the leaves. a) List all the values. Count 1 Stems Leaves 4 6 1 4 6 567 9 3688 026799 9 8 145667788 7 9 1234788 b) Calculate the first quartile (Q1) and the third Quartile (Q3). c) Calculate the interquartile range. d) Construct a boxplot for this data.arrow_forwardPam, Rob and Sam get a cake that is one-third chocolate, one-third vanilla, and one-third strawberry as shown below. They wish to fairly divide the cake using the lone chooser method. Pam likes strawberry twice as much as chocolate or vanilla. Rob only likes chocolate. Sam, the chooser, likes vanilla and strawberry twice as much as chocolate. In the first division, Pam cuts the strawberry piece off and lets Rob choose his favorite piece. Based on that, Rob chooses the chocolate and vanilla parts. Note: All cuts made to the cake shown below are vertical.Which is a second division that Rob would make of his share of the cake?arrow_forward
- Three players (one divider and two choosers) are going to divide a cake fairly using the lone divider method. The divider cuts the cake into three slices (s1, s2, and s3). If the choosers' declarations are Chooser 1: {s1 , s2} and Chooser 2: {s2 , s3}. Using the lone-divider method, how many different fair divisions of this cake are possible?arrow_forwardTheorem 2.6 (The Minkowski inequality) Let p≥1. Suppose that X and Y are random variables, such that E|X|P <∞ and E|Y P <00. Then X+YpX+Yparrow_forwardTheorem 1.2 (1) Suppose that P(|X|≤b) = 1 for some b > 0, that EX = 0, and set Var X = 0². Then, for 0 0, P(X > x) ≤e-x+1²² P(|X|>x) ≤2e-1x+1²² (ii) Let X1, X2...., Xn be independent random variables with mean 0, suppose that P(X ≤b) = 1 for all k, and set oσ = Var X. Then, for x > 0. and 0x) ≤2 exp Σ k=1 (iii) If, in addition, X1, X2, X, are identically distributed, then P(S|x) ≤2 expl-tx+nt²o).arrow_forward
- Theorem 5.1 (Jensen's inequality) state without proof the Jensen's Ineg. Let X be a random variable, g a convex function, and suppose that X and g(X) are integrable. Then g(EX) < Eg(X).arrow_forwardCan social media mistakes hurt your chances of finding a job? According to a survey of 1,000 hiring managers across many different industries, 76% claim that they use social media sites to research prospective candidates for any job. Calculate the probabilities of the following events. (Round your answers to three decimal places.) answer parts a-c. a) Out of 30 job listings, at least 19 will conduct social media screening. b) Out of 30 job listings, fewer than 17 will conduct social media screening. c) Out of 30 job listings, exactly between 19 and 22 (including 19 and 22) will conduct social media screening. show all steps for probabilities please. answer parts a-c.arrow_forwardQuestion: we know that for rt. (x+ys s ا. 13. rs. and my so using this, show that it vye and EIXI, EIYO This : E (IX + Y) ≤2" (EIX (" + Ely!")arrow_forward
- Theorem 2.4 (The Hölder inequality) Let p+q=1. If E|X|P < ∞ and E|Y| < ∞, then . |EXY ≤ E|XY|||X|| ||||qarrow_forwardTheorem 7.6 (Etemadi's inequality) Let X1, X2, X, be independent random variables. Then, for all x > 0, P(max |S|>3x) ≤3 max P(S| > x). Isk≤narrow_forwardTheorem 7.2 Suppose that E X = 0 for all k, that Var X = 0} x) ≤ 2P(S>x 1≤k≤n S√2), -S√2). P(max Sk>x) ≤ 2P(|S|>x- 1arrow_forwardarrow_back_iosSEE MORE QUESTIONSarrow_forward_ios
Recommended textbooks for you
 Algebra: Structure And Method, Book 1AlgebraISBN:9780395977224Author:Richard G. Brown, Mary P. Dolciani, Robert H. Sorgenfrey, William L. ColePublisher:McDougal Littell
 College AlgebraAlgebraISBN:9781305115545Author:James Stewart, Lothar Redlin, Saleem WatsonPublisher:Cengage Learning
 Algebra & Trigonometry with Analytic GeometryAlgebraISBN:9781133382119Author:SwokowskiPublisher:Cengage
 Big Ideas Math A Bridge To Success Algebra 1: Stu...AlgebraISBN:9781680331141Author:HOUGHTON MIFFLIN HARCOURTPublisher:Houghton Mifflin Harcourt
 Holt Mcdougal Larson Pre-algebra: Student Edition...AlgebraISBN:9780547587776Author:HOLT MCDOUGALPublisher:HOLT MCDOUGAL
Algebra: Structure And Method, Book 1
Algebra
ISBN:9780395977224
Author:Richard G. Brown, Mary P. Dolciani, Robert H. Sorgenfrey, William L. Cole
Publisher:McDougal Littell
College Algebra
Algebra
ISBN:9781305115545
Author:James Stewart, Lothar Redlin, Saleem Watson
Publisher:Cengage Learning
Algebra & Trigonometry with Analytic Geometry
Algebra
ISBN:9781133382119
Author:Swokowski
Publisher:Cengage
Big Ideas Math A Bridge To Success Algebra 1: Stu...
Algebra
ISBN:9781680331141
Author:HOUGHTON MIFFLIN HARCOURT
Publisher:Houghton Mifflin Harcourt
Holt Mcdougal Larson Pre-algebra: Student Edition...
Algebra
ISBN:9780547587776
Author:HOLT MCDOUGAL
Publisher:HOLT MCDOUGAL
Use of ALGEBRA in REAL LIFE; Author: Fast and Easy Maths !;https://www.youtube.com/watch?v=9_PbWFpvkDc;License: Standard YouTube License, CC-BY
Compound Interest Formula Explained, Investment, Monthly & Continuously, Word Problems, Algebra; Author: The Organic Chemistry Tutor;https://www.youtube.com/watch?v=P182Abv3fOk;License: Standard YouTube License, CC-BY
Applications of Algebra (Digit, Age, Work, Clock, Mixture and Rate Problems); Author: EngineerProf PH;https://www.youtube.com/watch?v=Y8aJ_wYCS2g;License: Standard YouTube License, CC-BY