
Concept explainers
Videos
SAT Scores by Income The following bar graph shows U.S. critical reading SAT scores as a function of household income:
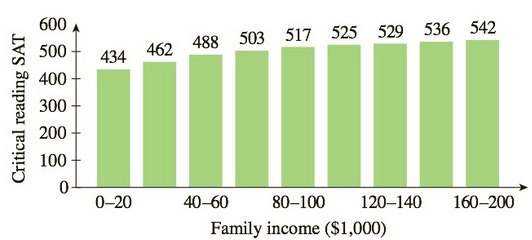
These data can be modeled by
Want to see the full answer?
Check out a sample textbook solution
Chapter 3 Solutions
Applied Calculus


- R₂ = X2 2) slots per pole per phase = 3/31 B-180 60 msl kd Kas Sin () 2 I sin (6) sin(30) Sin (30) اذا مريد شرح الكتب بس 0 بالفراغ 3 Cos (30) 0.866 4) Rotating ined sove in peaper 5) Synchronous speed s 120×50 6 s = 1000-950 1000 Copper losses 5kw Rotor input 5 0.05 6) 1 loo kw اذا ميريد شرح الكتب فقط Look 7) rotov DC I need a detailed solution on paper please 0 64 Solve the following equations: 0 Q1// Find the solution of: ( y • with y(0) = 1. dx x²+y²arrow_forwardR₂ = X2 2) slots per pole per phase = 3/3 1 B-180-60 msl Ka Sin (1) Isin () sin(30) Sin (30) اذا ميريد شرح الكتب بس 0 بالفراغ 3) Cos (30) 0.866 4) Rotating 5) Synchronous speed, 120 x 50 s = 1000-950 1000 Copper losses 5kw Rotor input 5 6) 1 0.05 G 50105 loo kw اذا ميريد شرح الكتب فقط look 7) rotov DC ined sove in peaper I need a detailed solution on paper please 064 2- A hot ball (D=15 cm ) is cooled by forced air T.-30°C, the rate of heat transfer from the ball is 460.86 W. Take for the air -0.025 Wim °C and Nu=144.89, find the ball surface temperature a) 300 °C 16 b) 327 °C c) 376 °C d) None か = 750 01arrow_forwardDon't do 14. Please solve 19arrow_forward
- Please solve 14 and 15arrow_forward1. Consider the following system of equations: x13x2 + 4x3 - 5x4 = 7 -2x13x2 + x3 - 6x4 = 7 x16x213x3 - 21x4 = 28 a) Solve the system. Write your solution in parametric and vector form. b) What is a geometric description of the solution. 7 c) Is v = 7 in the span of the set S= [28. 1 HE 3 -5 3 ·6 ? If it is, write v 6 as a linear combination of the vectors in S. Justify. d) How many solutions are there to the associated homogeneous system for the system above? Justify. e) Let A be the coefficient matrix from the system above. Find the set of all solutions to Ax = 0. f) Is there a solution to Ax=b for all b in R³? Justify.arrow_forward4. Suppose that A is made up of 5 column vectors in R³, and suppose that the rank(A)=3. a. How many solutions are there to Ax=0? Justify. b. What is a geometric description for the nullspace(A)? Justify. c. Do the column vectors of A span R³? Justify. d. Is A invertible? Justify.arrow_forward
- 3. Suppose that A is 5 x 5 and rank(A)=4. Use this information to answer the following. a. Give a geometric description of nullspace(A). Justify. b. Is A invertible? Justify. c. Give a geometric description of the span of the column vectors of A. What space are the column vectors of A in? Justify. d. What is determinant of A? Justify.arrow_forward2. Consider the matrix: A || 1 1 -3 14 2 1 01 4 1 2 2 -26 1 -3 1 5] a) What is rank(A)? b) Is A invertible? Justify. c) Find the nullspace(A). Justify. d) Is the trivial solution the only solution to Ax=0? Justify. e) What is the span of the column vectors of A? Justify.arrow_forwardE 5. Suppose that S={v € R²: v = [2x² - 3]}. Is S a subspace of R²? Prove or disprovearrow_forward
- 6. Suppose that V1, V2 ER", show that span{v1, v2} is a subspace of Rn.arrow_forwardRa X 2) slots per pole per phase 3/31 180 Ko Sin (1) Kdl 1 sin (4) sin(3) Sin (30) اذا مرید شرح الكتب بس 0 بالفراغ 3) Cos (30) 0.866 4) Rotating 5) Synchronous speed, 120 Fo lasa! G s.1000-950 20:05 1000 Capper losses: 5kw Rotor input lookw 0.05 ined sove in peaper I need a detailed solution on paper please 6) 1 ۳/۱ وه اذا ميريد شرح الكتب فقط look DC 7) rotov Find the general solution of the following equations: +4y=tan2x 3 7357 Find the general solution of the following equations: - Qll y + y (³) = 0. 101arrow_forwardB: 18060 msl Kd Ka, Sin (n) I sin () sin(30) Sin (30) اذا ميريد شرح الكتب بس 0 بالفراغ 3) Cos (30) 0.866 4) Rotating 5) Synchronous speed, 120 x 50 G 5005 1000 s = 1000-950 Copper bosses 5kW /0001 Rotor input 5 : loo kw 0.05 6) 1 اذا ميريد شرح الكتب فقط ١٥٠ 7) rotov DC ined sove in Deaper I need a detailed solution on paper please dy x+2y-4 = dx 2x-y-3 Find the general solution of the following equations: 02//yl-4y+13y=esinarrow_forward
 Elementary Linear Algebra (MindTap Course List)AlgebraISBN:9781305658004Author:Ron LarsonPublisher:Cengage Learning
 Algebra & Trigonometry with Analytic GeometryAlgebraISBN:9781133382119Author:SwokowskiPublisher:Cengage
 Glencoe Algebra 1, Student Edition, 9780079039897...AlgebraISBN:9780079039897Author:CarterPublisher:McGraw Hill
 Trigonometry (MindTap Course List)TrigonometryISBN:9781337278461Author:Ron LarsonPublisher:Cengage Learning