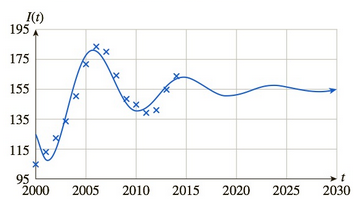
Home Prices The following graph shows the values of the home price index 12 for 2000–2014 together with a mathematical model I extrapolating the data: Estimate and interpret lim t → + ∞ I ( t ) ,
Home Prices The following graph shows the values of the home price index 12 for 2000–2014 together with a mathematical model I extrapolating the data: Estimate and interpret lim t → + ∞ I ( t ) ,
Solution Summary: The author analyzes the graph which shows the values of the home price index for years 2000-2014 and interprets that it will get leveled off at 155 in the long term.
1. A bicyclist is riding their bike along the Chicago Lakefront Trail. The velocity (in
feet per second) of the bicyclist is recorded below. Use (a) Simpson's Rule, and (b)
the Trapezoidal Rule to estimate the total distance the bicyclist traveled during the
8-second period.
t
0 2
4 6 8
V
10 15
12 10 16
2. Find the midpoint rule approximation for
(a) n = 4
+5
x²dx using n subintervals.
1° 2
(b) n = 8
36
32
28
36
32
28
24
24
20
20
16
16
12
8-
4
1
2
3
4
5
6
12
8
4
1
2
3
4
5
6
=
5 37
A 4 8 0.5
06
9
Consider the following system of equations, Ax=b :
x+2y+3z - w = 2
2x4z2w = 3
-x+6y+17z7w = 0
-9x-2y+13z7w = -14
a. Find the solution to the system. Write it as a parametric equation. You can use a
computer to do the row reduction.
b. What is a geometric description of the solution? Explain how you know.
c. Write the solution in vector form?
d. What is the solution to the homogeneous system, Ax=0?
Need a deep-dive on the concept behind this application? Look no further. Learn more about this topic, calculus and related others by exploring similar questions and additional content below.


 Algebra & Trigonometry with Analytic GeometryAlgebraISBN:9781133382119Author:SwokowskiPublisher:Cengage
 College Algebra (MindTap Course List)AlgebraISBN:9781305652231Author:R. David Gustafson, Jeff HughesPublisher:Cengage Learning