
Elementary Statistics (13th Edition)
13th Edition
ISBN: 9780134462455
Author: Mario F. Triola
Publisher: PEARSON
expand_more
expand_more
format_list_bulleted
Concept explainers
Videos
Textbook Question
Chapter 3.3, Problem 28BSC
Percentiles. In Exercises 17-20, use the following cell phone airport data speeds (Mbps) from Sprint. Find the percentile corresponding to the given data speed.
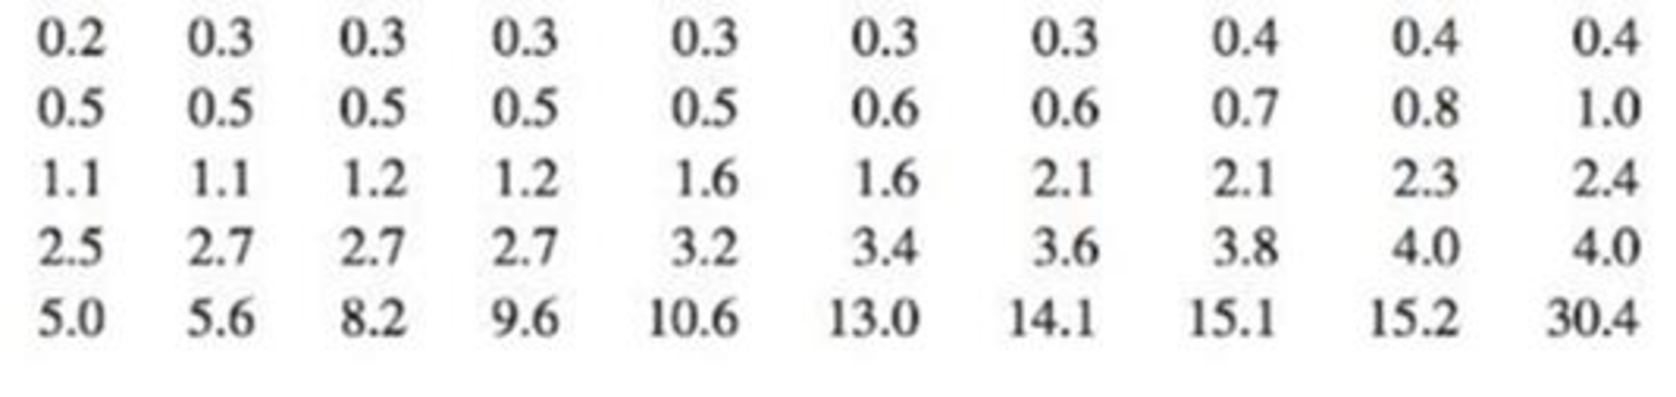
In Exercises 21-28, use the same list of Sprint airport data speeds (Mbps) given for Exercises 17-20. Find the indicated percentile or
28. P85
Expert Solution & Answer
Want to see the full answer?
Check out a sample textbook solution
Students have asked these similar questions
2011 listing by carmax
of the ages and prices of various corollas in a ceratin region
س 11/ أ . اذا كانت 1 + x) = 2 x 3 + 2 x 2 + x) هي متعددة حدود محسوبة باستخدام طريقة
الفروقات المنتهية (finite differences) من جدول البيانات التالي للدالة (f(x . احسب قيمة . ( 2 درجة )
xi k=0 k=1 k=2 k=3
0
3
1
2
2
2
3
α
1. Differentiate between discrete and continuous random variables,
providing examples for each type.
2. Consider a discrete random variable representing the number of
patients visiting a clinic each day. The probabilities for the
number of visits are as follows:
0 visits: P(0) = 0.2
1 visit: P(1) = 0.3
2 visits: P(2) = 0.5
Using this information, calculate the expected value (mean) of
the number of patient visits per day. Show all your workings
clearly.
Rubric to follow
Definition of Random variables ( clearly and accurately differentiate between discrete and continuous random variables with appropriate examples for each)
Identification of discrete random variable (correctly identifies "number of patient visits" as a discrete random variable and explains reasoning clearly.)
Calculation of probabilities (uses the probabilities correctly in the calculation, showing all steps clearly and logically)
Expected value calculation (calculate the expected value (mean)…
Chapter 3 Solutions
Elementary Statistics (13th Edition)
Ch. 3.1 - Average The defunct website IncomeTaxList.com...Ch. 3.1 - Whats Wrong? USA Today published a list consisting...Ch. 3.1 - Measures of Center In what sense are the mean,...Ch. 3.1 - Resistant Measures Here are four of the Verizon...Ch. 3.1 - Critical Thinking. For Exercises 5-20, watch out...Ch. 3.1 - Critical Thinking. For Exercises 5-20, watch out...Ch. 3.1 - Critical Thinking. For Exercises 5-20, watch out...Ch. 3.1 - Critical Thinking. For Exercises 5-20, watch out...Ch. 3.1 - Critical Thinking. For Exercises 5-20, watch out...Ch. 3.1 - Critical Thinking. For Exercises 5-20, watch out...
Ch. 3.1 - Critical Thinking. For Exercises 5-20, watch out...Ch. 3.1 - Critical Thinking. For Exercises 5-20, watch out...Ch. 3.1 - Critical Thinking. For Exercises 5-20, watch out...Ch. 3.1 - Critical Thinking. For Exercises 5-20, watch out...Ch. 3.1 - Critical Thinking. For Exercises 5-20, watch out...Ch. 3.1 - Critical Thinking. For Exercises 5-20, watch out...Ch. 3.1 - Critical Thinking. For Exercises 5-20, watch out...Ch. 3.1 - Critical Thinking. For Exercises 5-20, watch out...Ch. 3.1 - Critical Thinking. For Exercises 5-20, watch out...Ch. 3.1 - Critical Thinking. For Exercises 5-20, watch out...Ch. 3.1 - In Exercises 21-24, find the mean and median for...Ch. 3.1 - In Exercises 21-24, find the mean and median for...Ch. 3.1 - In Exercises 21-24, find the mean and median for...Ch. 3.1 - In Exercises 21-24, find the mean and median for...Ch. 3.1 - Large Data Sets from Appendix B. In Exercises...Ch. 3.1 - Large Data Sets from Appendix B. In Exercises...Ch. 3.1 - Large Data Sets from Appendix B. In Exercises...Ch. 3.1 - Large Data Sets from Appendix B. In Exercises...Ch. 3.1 - In Exercises 29-32, find the mean of the data...Ch. 3.1 - In Exercises 29-32, find the mean of the data...Ch. 3.1 - In Exercises 29-32, find the mean of the data...Ch. 3.1 - In Exercises 29-32, find the mean of the data...Ch. 3.1 - Weighted Mean A student of the author earned...Ch. 3.1 - Weighted Mean A student of the author earned...Ch. 3.1 - Degrees of Freedom Five pulse rates randomly...Ch. 3.1 - Censored Data Data Set 15 Presidents in Appendix B...Ch. 3.1 - Trimmed Mean Because the mean is very sensitive to...Ch. 3.1 - Harmonic Mean The harmonic mean is often used as a...Ch. 3.1 - Geometric Mean The geometric mean is often used in...Ch. 3.1 - Quadratic Mean The quadratic mean (or root mean...Ch. 3.1 - Median When data are summarized in a frequency...Ch. 3.2 - Range Rule of Thumb for Estimating s The 20 brain...Ch. 3.2 - Range Rule of Thumb for Interpreting s The 20...Ch. 3.2 - Variance The 20 subjects used in Data Set 8 IQ and...Ch. 3.2 - Symbols Identify the symbols used for each of the...Ch. 3.2 - In Exercises 5-20, find the range, variance, and...Ch. 3.2 - In Exercises 5-20, find the range, variance, and...Ch. 3.2 - In Exercises 5-20, find the range, variance, and...Ch. 3.2 - In Exercises 5-20, find the range, variance, and...Ch. 3.2 - In Exercises 5-20, find the range, variance, and...Ch. 3.2 - In Exercises 5-20, find the range, variance, and...Ch. 3.2 - In Exercises 5-20, find the range, variance, and...Ch. 3.2 - In Exercises 5-20, find the range, variance, and...Ch. 3.2 - In Exercises 5-20, find the range, variance, and...Ch. 3.2 - In Exercises 5-20, find the range, variance, and...Ch. 3.2 - In Exercises 5-20, find the range, variance, and...Ch. 3.2 - In Exercises 5-20, find the range, variance, and...Ch. 3.2 - In Exercises 5-20, find the range, variance, and...Ch. 3.2 - In Exercises 5-20, find the range, variance, and...Ch. 3.2 - In Exercises 5-20, find the range, variance, and...Ch. 3.2 - In Exercises 5-20, find the range, variance, and...Ch. 3.2 - In Exercises 21-24, find the coefficient of...Ch. 3.2 - In Exercises 21-24, find the coefficient of...Ch. 3.2 - In Exercises 21-24, find the coefficient of...Ch. 3.2 - In Exercises 21-24, find the coefficient of...Ch. 3.2 - Large Data Sets from Appendix B. In Exercises...Ch. 3.2 - Prob. 26BSCCh. 3.2 - Large Data Sets from Appendix B. In Exercises...Ch. 3.2 - Large Data Sets from Appendix B. In Exercises...Ch. 3.2 - Estimating Standard Deviation with the Range Rule...Ch. 3.2 - Prob. 30BSCCh. 3.2 - Estimating Standard Deviation with the Range Rule...Ch. 3.2 - Estimating Standard Deviation with the Range Rule...Ch. 3.2 - Identifying Significant Values with the Range Rule...Ch. 3.2 - Prob. 34BSCCh. 3.2 - Foot Lengths Based on Data Set 2 Foot and Height...Ch. 3.2 - Identifying Significant Values with the Range Rule...Ch. 3.2 - Finding Standard Deviation from a Frequency...Ch. 3.2 - Finding Standard Deviation from a Frequency...Ch. 3.2 - Finding Standard Deviation from a Frequency...Ch. 3.2 - Finding Standard Deviation from a Frequency...Ch. 3.2 - The Empirical Rule Based on Data Set 1 Body Data...Ch. 3.2 - The Empirical Rule Based on Data Set 3 Body...Ch. 3.2 - Chebyshevs Theorem Based on Data Set 1 Body Data...Ch. 3.2 - Chebyshevs Theorem Based on Data Set 3 Body...Ch. 3.2 - Why Divide by n 1? Let a population consist of...Ch. 3.2 - Mean Absolute Deviation Use the same population of...Ch. 3.3 - z Scores LeBron James, one of the most successful...Ch. 3.3 - Heights The boxplot shown below results from the...Ch. 3.3 - Boxplot Comparison Refer to the boxplots shown...Ch. 3.3 - z Scores If your score on your next statistics...Ch. 3.3 - z Scores. In Exercises 5-8, express all z scores...Ch. 3.3 - z Scores. In Exercises 5-8, express all z scores...Ch. 3.3 - z Scores. In Exercises 5-8, express all z scores...Ch. 3.3 - z Scores. In Exercises 5-8, express all z scores...Ch. 3.3 - Significant Values. In Exercises 9-12, consider a...Ch. 3.3 - Significant Values. In Exercises 9-12, consider a...Ch. 3.3 - Significant Values. In Exercises 9-12, consider a...Ch. 3.3 - Significant Values. In Exercises 9-12, consider a...Ch. 3.3 - Comparing Values. In Exercises 13-16, use z scores...Ch. 3.3 - Comparing Values. In Exercises 13-16, use z scores...Ch. 3.3 - Comparing Values. In Exercises 13-16, use z scores...Ch. 3.3 - Comparing Values. In Exercises 13-16, use z scores...Ch. 3.3 - Percentiles. In Exercises 17-20, use the following...Ch. 3.3 - Percentiles. In Exercises 17-20, use the following...Ch. 3.3 - Percentiles. In Exercises 17-20, use the following...Ch. 3.3 - Percentiles. In Exercises 17-20, use the following...Ch. 3.3 - Percentiles. In Exercises 17-20, use the following...Ch. 3.3 - Percentiles. In Exercises 17-20, use the following...Ch. 3.3 - Percentiles. In Exercises 17-20, use the following...Ch. 3.3 - Percentiles. In Exercises 17-20, use the following...Ch. 3.3 - Percentiles. In Exercises 17-20, use the following...Ch. 3.3 - Percentiles. In Exercises 17-20, use the following...Ch. 3.3 - Percentiles. In Exercises 17-20, use the following...Ch. 3.3 - Percentiles. In Exercises 17-20, use the following...Ch. 3.3 - Boxplots. In Exercises 29-32, use the given data...Ch. 3.3 - Boxplots. In Exercises 29-32, use the given data...Ch. 3.3 - Boxplots. In Exercises 29-32, use the given data...Ch. 3.3 - Boxplots. In Exercises 29-32, use the given data...Ch. 3.3 - Boxplots from Large Data Sets in Appendix B. In...Ch. 3.3 - Boxplots from Large Data Sets in Appendix B. In...Ch. 3.3 - Prob. 35BSCCh. 3.3 - Boxplots from Large Data Sets in Appendix B. In...Ch. 3.3 - Outliers and Modified Boxplots Repeat Exercise 33...Ch. 3 - Sleep Mean As part of the National Health and...Ch. 3 - Sleep Median What is the median of the sample...Ch. 3 - Sleep Mode What is the mode of the sample values...Ch. 3 - Sleep Variance The standard deviation of the...Ch. 3 - Prob. 5CQQCh. 3 - Sleep z Score A larger sample of 50 sleep times...Ch. 3 - Sleep Q3 For a sample of 80 sleep times,...Ch. 3 - Sleep 5-Number Summary For a sample of 100 sleep...Ch. 3 - Estimating s A large sample of sleep times...Ch. 3 - Sleep Notation Consider a sample of sleep times...Ch. 3 - Old Faithful Geyser Listed below are prediction...Ch. 3 - z Score Using the sample data from Exercise 1,...Ch. 3 - Boxplot Using the same prediction errors listed in...Ch. 3 - ER Codes In an analysis of activities that...Ch. 3 - Comparing Birth Weights The birth weights of a...Ch. 3 - Effects of an Outlier Listed below are platelet...Ch. 3 - Interpreting a Boxplot Shown below is a boxplot of...Ch. 3 - Estimating Standard Deviation Listed below is a...Ch. 3 - Prob. 1CRECh. 3 - Prob. 2CRECh. 3 - Stemplot Use the amounts of arsenic from Exercise...Ch. 3 - Prob. 4CRECh. 3 - Histogram The accompanying histogram depicts...Ch. 3 - Normal Distribution Examine the distribution shown...Ch. 3 - Words Spoken by Men and Women Refer to Data Set 24...Ch. 3 - Second-Hand Smoke Data Set 12 Passive and Active...
Additional Math Textbook Solutions
Find more solutions based on key concepts
(a) Make a stem-and-leaf plot for these 24 observations on the number of customers who used a down-town CitiBan...
APPLIED STAT.IN BUS.+ECONOMICS
Provide an example of a qualitative variable and an example of a quantitative variable.
Elementary Statistics ( 3rd International Edition ) Isbn:9781260092561
For Problems 23-28, write in simpler form, as in Example 4. logbFG
Finite Mathematics for Business, Economics, Life Sciences and Social Sciences
Length of a Guy Wire A communications tower is located at the top of a steep hill, as shown. The angle of incli...
Precalculus: Mathematics for Calculus (Standalone Book)
Find E(X) for each of the distributions given in Exercise 2.1-3.
Probability And Statistical Inference (10th Edition)
Knowledge Booster


Learn more about
Need a deep-dive on the concept behind this application? Look no further. Learn more about this topic, statistics and related others by exploring similar questions and additional content below.Similar questions
- if the b coloumn of a z table disappeared what would be used to determine b column probabilitiesarrow_forwardConstruct a model of population flow between metropolitan and nonmetropolitan areas of a given country, given that their respective populations in 2015 were 263 million and 45 million. The probabilities are given by the following matrix. (from) (to) metro nonmetro 0.99 0.02 metro 0.01 0.98 nonmetro Predict the population distributions of metropolitan and nonmetropolitan areas for the years 2016 through 2020 (in millions, to four decimal places). (Let x, through x5 represent the years 2016 through 2020, respectively.) x₁ = x2 X3 261.27 46.73 11 259.59 48.41 11 257.96 50.04 11 256.39 51.61 11 tarrow_forwardIf the average price of a new one family home is $246,300 with a standard deviation of $15,000 find the minimum and maximum prices of the houses that a contractor will build to satisfy 88% of the market valuearrow_forward
- 21. ANALYSIS OF LAST DIGITS Heights of statistics students were obtained by the author as part of an experiment conducted for class. The last digits of those heights are listed below. Construct a frequency distribution with 10 classes. Based on the distribution, do the heights appear to be reported or actually measured? Does there appear to be a gap in the frequencies and, if so, how might that gap be explained? What do you know about the accuracy of the results? 3 4 555 0 0 0 0 0 0 0 0 0 1 1 23 3 5 5 5 5 5 5 5 5 5 5 5 5 6 6 8 8 8 9arrow_forwardA side view of a recycling bin lid is diagramed below where two panels come together at a right angle. 45 in 24 in Width? — Given this information, how wide is the recycling bin in inches?arrow_forward1 No. 2 3 4 Binomial Prob. X n P Answer 5 6 4 7 8 9 10 12345678 8 3 4 2 2552 10 0.7 0.233 0.3 0.132 7 0.6 0.290 20 0.02 0.053 150 1000 0.15 0.035 8 7 10 0.7 0.383 11 9 3 5 0.3 0.132 12 10 4 7 0.6 0.290 13 Poisson Probability 14 X lambda Answer 18 4 19 20 21 22 23 9 15 16 17 3 1234567829 3 2 0.180 2 1.5 0.251 12 10 0.095 5 3 0.101 7 4 0.060 3 2 0.180 2 1.5 0.251 24 10 12 10 0.095arrow_forward
- step by step on Microssoft on how to put this in excel and the answers please Find binomial probability if: x = 8, n = 10, p = 0.7 x= 3, n=5, p = 0.3 x = 4, n=7, p = 0.6 Quality Control: A factory produces light bulbs with a 2% defect rate. If a random sample of 20 bulbs is tested, what is the probability that exactly 2 bulbs are defective? (hint: p=2% or 0.02; x =2, n=20; use the same logic for the following problems) Marketing Campaign: A marketing company sends out 1,000 promotional emails. The probability of any email being opened is 0.15. What is the probability that exactly 150 emails will be opened? (hint: total emails or n=1000, x =150) Customer Satisfaction: A survey shows that 70% of customers are satisfied with a new product. Out of 10 randomly selected customers, what is the probability that at least 8 are satisfied? (hint: One of the keyword in this question is “at least 8”, it is not “exactly 8”, the correct formula for this should be = 1- (binom.dist(7, 10, 0.7,…arrow_forwardKate, Luke, Mary and Nancy are sharing a cake. The cake had previously been divided into four slices (s1, s2, s3 and s4). What is an example of fair division of the cake S1 S2 S3 S4 Kate $4.00 $6.00 $6.00 $4.00 Luke $5.30 $5.00 $5.25 $5.45 Mary $4.25 $4.50 $3.50 $3.75 Nancy $6.00 $4.00 $4.00 $6.00arrow_forwardFaye cuts the sandwich in two fair shares to her. What is the first half s1arrow_forward
- Question 2. An American option on a stock has payoff given by F = f(St) when it is exercised at time t. We know that the function f is convex. A person claims that because of convexity, it is optimal to exercise at expiration T. Do you agree with them?arrow_forwardQuestion 4. We consider a CRR model with So == 5 and up and down factors u = 1.03 and d = 0.96. We consider the interest rate r = 4% (over one period). Is this a suitable CRR model? (Explain your answer.)arrow_forwardQuestion 3. We want to price a put option with strike price K and expiration T. Two financial advisors estimate the parameters with two different statistical methods: they obtain the same return rate μ, the same volatility σ, but the first advisor has interest r₁ and the second advisor has interest rate r2 (r1>r2). They both use a CRR model with the same number of periods to price the option. Which advisor will get the larger price? (Explain your answer.)arrow_forward
arrow_back_ios
SEE MORE QUESTIONS
arrow_forward_ios
Recommended textbooks for you
 Glencoe Algebra 1, Student Edition, 9780079039897...AlgebraISBN:9780079039897Author:CarterPublisher:McGraw Hill
 Holt Mcdougal Larson Pre-algebra: Student Edition...AlgebraISBN:9780547587776Author:HOLT MCDOUGALPublisher:HOLT MCDOUGAL
 Big Ideas Math A Bridge To Success Algebra 1: Stu...AlgebraISBN:9781680331141Author:HOUGHTON MIFFLIN HARCOURTPublisher:Houghton Mifflin Harcourt
Glencoe Algebra 1, Student Edition, 9780079039897...
Algebra
ISBN:9780079039897
Author:Carter
Publisher:McGraw Hill
Holt Mcdougal Larson Pre-algebra: Student Edition...
Algebra
ISBN:9780547587776
Author:HOLT MCDOUGAL
Publisher:HOLT MCDOUGAL
Big Ideas Math A Bridge To Success Algebra 1: Stu...
Algebra
ISBN:9781680331141
Author:HOUGHTON MIFFLIN HARCOURT
Publisher:Houghton Mifflin Harcourt
The Shape of Data: Distributions: Crash Course Statistics #7; Author: CrashCourse;https://www.youtube.com/watch?v=bPFNxD3Yg6U;License: Standard YouTube License, CC-BY
Shape, Center, and Spread - Module 20.2 (Part 1); Author: Mrmathblog;https://www.youtube.com/watch?v=COaid7O_Gag;License: Standard YouTube License, CC-BY
Shape, Center and Spread; Author: Emily Murdock;https://www.youtube.com/watch?v=_YyW0DSCzpM;License: Standard Youtube License