
Elementary Statistics (13th Edition)
13th Edition
ISBN: 9780134462455
Author: Mario F. Triola
Publisher: PEARSON
expand_more
expand_more
format_list_bulleted
Videos
Textbook Question
Chapter 3.2, Problem 21BSC
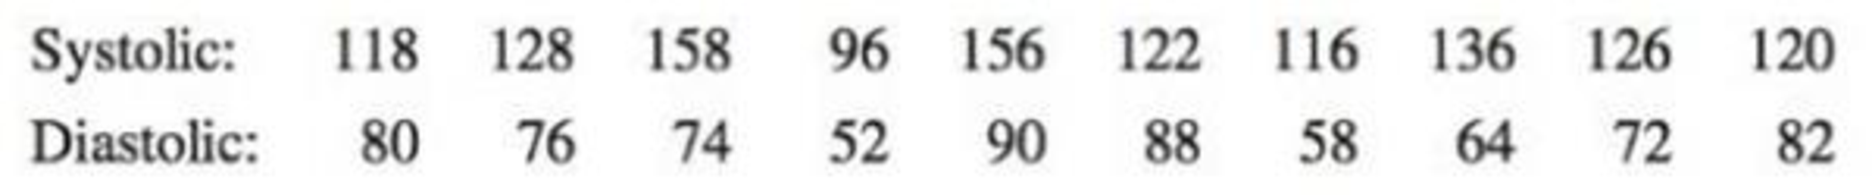
In Exercises 21-24, find the coefficient of variation for each of the two samples; then compare the variation. (The same data were used in Section 3-1.)
21. Blood Pressure A sample of blood pressure measurements is taken from Data Set 1 “Body Data” in Appendix B, and those values (mm Hg) are listed below. The values are matched so that 10 subjects each have a systolic and diastolic measurement.
Expert Solution & Answer

Learn your wayIncludes step-by-step video

schedule03:46
Students have asked these similar questions
1 No.
2
3
4
Binomial Prob.
X
n
P
Answer
5
6 4
7
8
9
10
12345678
8
3
4
2
2552
10
0.7
0.233
0.3
0.132
7
0.6
0.290
20
0.02
0.053
150
1000
0.15
0.035
8
7
10
0.7
0.383
11
9
3
5
0.3
0.132
12
10
4
7
0.6
0.290
13
Poisson Probability
14
X
lambda
Answer
18 4
19
20
21
22
23 9
15
16
17 3
1234567829
3
2
0.180
2
1.5
0.251
12
10
0.095
5
3
0.101
7
4
0.060
3
2
0.180
2
1.5
0.251
24 10
12
10
0.095
step by step on Microssoft on how to put this in excel and the answers please
Find binomial probability if:
x = 8, n = 10, p = 0.7
x= 3, n=5, p = 0.3
x = 4, n=7, p = 0.6
Quality Control: A factory produces light bulbs with a 2% defect rate. If a random sample of 20 bulbs is tested, what is the probability that exactly 2 bulbs are defective? (hint: p=2% or 0.02; x =2, n=20; use the same logic for the following problems)
Marketing Campaign: A marketing company sends out 1,000 promotional emails. The probability of any email being opened is 0.15. What is the probability that exactly 150 emails will be opened? (hint: total emails or n=1000, x =150)
Customer Satisfaction: A survey shows that 70% of customers are satisfied with a new product. Out of 10 randomly selected customers, what is the probability that at least 8 are satisfied? (hint: One of the keyword in this question is “at least 8”, it is not “exactly 8”, the correct formula for this should be = 1- (binom.dist(7, 10, 0.7,…
Kate, Luke, Mary and Nancy are sharing a cake. The cake had previously been divided into four slices (s1, s2, s3 and s4). What is an example of fair division of the cake
S1
S2
S3
S4
Kate
$4.00
$6.00
$6.00
$4.00
Luke
$5.30
$5.00
$5.25
$5.45
Mary
$4.25
$4.50
$3.50
$3.75
Nancy
$6.00
$4.00
$4.00
$6.00
Chapter 3 Solutions
Elementary Statistics (13th Edition)
Ch. 3.1 - Average The defunct website IncomeTaxList.com...Ch. 3.1 - Whats Wrong? USA Today published a list consisting...Ch. 3.1 - Measures of Center In what sense are the mean,...Ch. 3.1 - Resistant Measures Here are four of the Verizon...Ch. 3.1 - Critical Thinking. For Exercises 5-20, watch out...Ch. 3.1 - Critical Thinking. For Exercises 5-20, watch out...Ch. 3.1 - Critical Thinking. For Exercises 5-20, watch out...Ch. 3.1 - Critical Thinking. For Exercises 5-20, watch out...Ch. 3.1 - Critical Thinking. For Exercises 5-20, watch out...Ch. 3.1 - Critical Thinking. For Exercises 5-20, watch out...
Ch. 3.1 - Critical Thinking. For Exercises 5-20, watch out...Ch. 3.1 - Critical Thinking. For Exercises 5-20, watch out...Ch. 3.1 - Critical Thinking. For Exercises 5-20, watch out...Ch. 3.1 - Critical Thinking. For Exercises 5-20, watch out...Ch. 3.1 - Critical Thinking. For Exercises 5-20, watch out...Ch. 3.1 - Critical Thinking. For Exercises 5-20, watch out...Ch. 3.1 - Critical Thinking. For Exercises 5-20, watch out...Ch. 3.1 - Critical Thinking. For Exercises 5-20, watch out...Ch. 3.1 - Critical Thinking. For Exercises 5-20, watch out...Ch. 3.1 - Critical Thinking. For Exercises 5-20, watch out...Ch. 3.1 - In Exercises 21-24, find the mean and median for...Ch. 3.1 - In Exercises 21-24, find the mean and median for...Ch. 3.1 - In Exercises 21-24, find the mean and median for...Ch. 3.1 - In Exercises 21-24, find the mean and median for...Ch. 3.1 - Large Data Sets from Appendix B. In Exercises...Ch. 3.1 - Large Data Sets from Appendix B. In Exercises...Ch. 3.1 - Large Data Sets from Appendix B. In Exercises...Ch. 3.1 - Large Data Sets from Appendix B. In Exercises...Ch. 3.1 - In Exercises 29-32, find the mean of the data...Ch. 3.1 - In Exercises 29-32, find the mean of the data...Ch. 3.1 - In Exercises 29-32, find the mean of the data...Ch. 3.1 - In Exercises 29-32, find the mean of the data...Ch. 3.1 - Weighted Mean A student of the author earned...Ch. 3.1 - Weighted Mean A student of the author earned...Ch. 3.1 - Degrees of Freedom Five pulse rates randomly...Ch. 3.1 - Censored Data Data Set 15 Presidents in Appendix B...Ch. 3.1 - Trimmed Mean Because the mean is very sensitive to...Ch. 3.1 - Harmonic Mean The harmonic mean is often used as a...Ch. 3.1 - Geometric Mean The geometric mean is often used in...Ch. 3.1 - Quadratic Mean The quadratic mean (or root mean...Ch. 3.1 - Median When data are summarized in a frequency...Ch. 3.2 - Range Rule of Thumb for Estimating s The 20 brain...Ch. 3.2 - Range Rule of Thumb for Interpreting s The 20...Ch. 3.2 - Variance The 20 subjects used in Data Set 8 IQ and...Ch. 3.2 - Symbols Identify the symbols used for each of the...Ch. 3.2 - In Exercises 5-20, find the range, variance, and...Ch. 3.2 - In Exercises 5-20, find the range, variance, and...Ch. 3.2 - In Exercises 5-20, find the range, variance, and...Ch. 3.2 - In Exercises 5-20, find the range, variance, and...Ch. 3.2 - In Exercises 5-20, find the range, variance, and...Ch. 3.2 - In Exercises 5-20, find the range, variance, and...Ch. 3.2 - In Exercises 5-20, find the range, variance, and...Ch. 3.2 - In Exercises 5-20, find the range, variance, and...Ch. 3.2 - In Exercises 5-20, find the range, variance, and...Ch. 3.2 - In Exercises 5-20, find the range, variance, and...Ch. 3.2 - In Exercises 5-20, find the range, variance, and...Ch. 3.2 - In Exercises 5-20, find the range, variance, and...Ch. 3.2 - In Exercises 5-20, find the range, variance, and...Ch. 3.2 - In Exercises 5-20, find the range, variance, and...Ch. 3.2 - In Exercises 5-20, find the range, variance, and...Ch. 3.2 - In Exercises 5-20, find the range, variance, and...Ch. 3.2 - In Exercises 21-24, find the coefficient of...Ch. 3.2 - In Exercises 21-24, find the coefficient of...Ch. 3.2 - In Exercises 21-24, find the coefficient of...Ch. 3.2 - In Exercises 21-24, find the coefficient of...Ch. 3.2 - Large Data Sets from Appendix B. In Exercises...Ch. 3.2 - Prob. 26BSCCh. 3.2 - Large Data Sets from Appendix B. In Exercises...Ch. 3.2 - Large Data Sets from Appendix B. In Exercises...Ch. 3.2 - Estimating Standard Deviation with the Range Rule...Ch. 3.2 - Prob. 30BSCCh. 3.2 - Estimating Standard Deviation with the Range Rule...Ch. 3.2 - Estimating Standard Deviation with the Range Rule...Ch. 3.2 - Identifying Significant Values with the Range Rule...Ch. 3.2 - Prob. 34BSCCh. 3.2 - Foot Lengths Based on Data Set 2 Foot and Height...Ch. 3.2 - Identifying Significant Values with the Range Rule...Ch. 3.2 - Finding Standard Deviation from a Frequency...Ch. 3.2 - Finding Standard Deviation from a Frequency...Ch. 3.2 - Finding Standard Deviation from a Frequency...Ch. 3.2 - Finding Standard Deviation from a Frequency...Ch. 3.2 - The Empirical Rule Based on Data Set 1 Body Data...Ch. 3.2 - The Empirical Rule Based on Data Set 3 Body...Ch. 3.2 - Chebyshevs Theorem Based on Data Set 1 Body Data...Ch. 3.2 - Chebyshevs Theorem Based on Data Set 3 Body...Ch. 3.2 - Why Divide by n 1? Let a population consist of...Ch. 3.2 - Mean Absolute Deviation Use the same population of...Ch. 3.3 - z Scores LeBron James, one of the most successful...Ch. 3.3 - Heights The boxplot shown below results from the...Ch. 3.3 - Boxplot Comparison Refer to the boxplots shown...Ch. 3.3 - z Scores If your score on your next statistics...Ch. 3.3 - z Scores. In Exercises 5-8, express all z scores...Ch. 3.3 - z Scores. In Exercises 5-8, express all z scores...Ch. 3.3 - z Scores. In Exercises 5-8, express all z scores...Ch. 3.3 - z Scores. In Exercises 5-8, express all z scores...Ch. 3.3 - Significant Values. In Exercises 9-12, consider a...Ch. 3.3 - Significant Values. In Exercises 9-12, consider a...Ch. 3.3 - Significant Values. In Exercises 9-12, consider a...Ch. 3.3 - Significant Values. In Exercises 9-12, consider a...Ch. 3.3 - Comparing Values. In Exercises 13-16, use z scores...Ch. 3.3 - Comparing Values. In Exercises 13-16, use z scores...Ch. 3.3 - Comparing Values. In Exercises 13-16, use z scores...Ch. 3.3 - Comparing Values. In Exercises 13-16, use z scores...Ch. 3.3 - Percentiles. In Exercises 17-20, use the following...Ch. 3.3 - Percentiles. In Exercises 17-20, use the following...Ch. 3.3 - Percentiles. In Exercises 17-20, use the following...Ch. 3.3 - Percentiles. In Exercises 17-20, use the following...Ch. 3.3 - Percentiles. In Exercises 17-20, use the following...Ch. 3.3 - Percentiles. In Exercises 17-20, use the following...Ch. 3.3 - Percentiles. In Exercises 17-20, use the following...Ch. 3.3 - Percentiles. In Exercises 17-20, use the following...Ch. 3.3 - Percentiles. In Exercises 17-20, use the following...Ch. 3.3 - Percentiles. In Exercises 17-20, use the following...Ch. 3.3 - Percentiles. In Exercises 17-20, use the following...Ch. 3.3 - Percentiles. In Exercises 17-20, use the following...Ch. 3.3 - Boxplots. In Exercises 29-32, use the given data...Ch. 3.3 - Boxplots. In Exercises 29-32, use the given data...Ch. 3.3 - Boxplots. In Exercises 29-32, use the given data...Ch. 3.3 - Boxplots. In Exercises 29-32, use the given data...Ch. 3.3 - Boxplots from Large Data Sets in Appendix B. In...Ch. 3.3 - Boxplots from Large Data Sets in Appendix B. In...Ch. 3.3 - Prob. 35BSCCh. 3.3 - Boxplots from Large Data Sets in Appendix B. In...Ch. 3.3 - Outliers and Modified Boxplots Repeat Exercise 33...Ch. 3 - Sleep Mean As part of the National Health and...Ch. 3 - Sleep Median What is the median of the sample...Ch. 3 - Sleep Mode What is the mode of the sample values...Ch. 3 - Sleep Variance The standard deviation of the...Ch. 3 - Prob. 5CQQCh. 3 - Sleep z Score A larger sample of 50 sleep times...Ch. 3 - Sleep Q3 For a sample of 80 sleep times,...Ch. 3 - Sleep 5-Number Summary For a sample of 100 sleep...Ch. 3 - Estimating s A large sample of sleep times...Ch. 3 - Sleep Notation Consider a sample of sleep times...Ch. 3 - Old Faithful Geyser Listed below are prediction...Ch. 3 - z Score Using the sample data from Exercise 1,...Ch. 3 - Boxplot Using the same prediction errors listed in...Ch. 3 - ER Codes In an analysis of activities that...Ch. 3 - Comparing Birth Weights The birth weights of a...Ch. 3 - Effects of an Outlier Listed below are platelet...Ch. 3 - Interpreting a Boxplot Shown below is a boxplot of...Ch. 3 - Estimating Standard Deviation Listed below is a...Ch. 3 - Prob. 1CRECh. 3 - Prob. 2CRECh. 3 - Stemplot Use the amounts of arsenic from Exercise...Ch. 3 - Prob. 4CRECh. 3 - Histogram The accompanying histogram depicts...Ch. 3 - Normal Distribution Examine the distribution shown...Ch. 3 - Words Spoken by Men and Women Refer to Data Set 24...Ch. 3 - Second-Hand Smoke Data Set 12 Passive and Active...
Additional Math Textbook Solutions
Find more solutions based on key concepts
Fill in each blank so that the resulting statement is true. An equation that expresses a relationship between t...
Algebra and Trigonometry (6th Edition)
Explain the meaning of the term “statistically significant difference” in statistics terminology.
Intro Stats, Books a la Carte Edition (5th Edition)
a. In how many ways can 3 boys and 3 girls sit in a row?
b. In how many ways can 3 boys and 3 girls sit in a r...
A First Course in Probability (10th Edition)
2. Source of Data In conducting a statistical study, why is it important to consider the source of the data?
Elementary Statistics
Chain Rule using a table Let h(x)= f(g(x)) and p(x) = g(f(x)). Use the table to compute the following derivativ...
Calculus: Early Transcendentals (2nd Edition)
Knowledge Booster


Learn more about
Need a deep-dive on the concept behind this application? Look no further. Learn more about this topic, statistics and related others by exploring similar questions and additional content below.Similar questions
- Faye cuts the sandwich in two fair shares to her. What is the first half s1arrow_forwardQuestion 2. An American option on a stock has payoff given by F = f(St) when it is exercised at time t. We know that the function f is convex. A person claims that because of convexity, it is optimal to exercise at expiration T. Do you agree with them?arrow_forwardQuestion 4. We consider a CRR model with So == 5 and up and down factors u = 1.03 and d = 0.96. We consider the interest rate r = 4% (over one period). Is this a suitable CRR model? (Explain your answer.)arrow_forward
- Question 3. We want to price a put option with strike price K and expiration T. Two financial advisors estimate the parameters with two different statistical methods: they obtain the same return rate μ, the same volatility σ, but the first advisor has interest r₁ and the second advisor has interest rate r2 (r1>r2). They both use a CRR model with the same number of periods to price the option. Which advisor will get the larger price? (Explain your answer.)arrow_forwardQuestion 5. We consider a put option with strike price K and expiration T. This option is priced using a 1-period CRR model. We consider r > 0, and σ > 0 very large. What is the approximate price of the option? In other words, what is the limit of the price of the option as σ∞. (Briefly justify your answer.)arrow_forwardQuestion 6. You collect daily data for the stock of a company Z over the past 4 months (i.e. 80 days) and calculate the log-returns (yk)/(-1. You want to build a CRR model for the evolution of the stock. The expected value and standard deviation of the log-returns are y = 0.06 and Sy 0.1. The money market interest rate is r = 0.04. Determine the risk-neutral probability of the model.arrow_forward
- Several markets (Japan, Switzerland) introduced negative interest rates on their money market. In this problem, we will consider an annual interest rate r < 0. We consider a stock modeled by an N-period CRR model where each period is 1 year (At = 1) and the up and down factors are u and d. (a) We consider an American put option with strike price K and expiration T. Prove that if <0, the optimal strategy is to wait until expiration T to exercise.arrow_forwardWe consider an N-period CRR model where each period is 1 year (At = 1), the up factor is u = 0.1, the down factor is d = e−0.3 and r = 0. We remind you that in the CRR model, the stock price at time tn is modeled (under P) by Sta = So exp (μtn + σ√AtZn), where (Zn) is a simple symmetric random walk. (a) Find the parameters μ and σ for the CRR model described above. (b) Find P Ste So 55/50 € > 1). StN (c) Find lim P 804-N (d) Determine q. (You can use e- 1 x.) Ste (e) Find Q So (f) Find lim Q 004-N StN Soarrow_forwardIn this problem, we consider a 3-period stock market model with evolution given in Fig. 1 below. Each period corresponds to one year. The interest rate is r = 0%. 16 22 28 12 16 12 8 4 2 time Figure 1: Stock evolution for Problem 1. (a) A colleague notices that in the model above, a movement up-down leads to the same value as a movement down-up. He concludes that the model is a CRR model. Is your colleague correct? (Explain your answer.) (b) We consider a European put with strike price K = 10 and expiration T = 3 years. Find the price of this option at time 0. Provide the replicating portfolio for the first period. (c) In addition to the call above, we also consider a European call with strike price K = 10 and expiration T = 3 years. Which one has the highest price? (It is not necessary to provide the price of the call.) (d) We now assume a yearly interest rate r = 25%. We consider a Bermudan put option with strike price K = 10. It works like a standard put, but you can exercise it…arrow_forward
- In this problem, we consider a 2-period stock market model with evolution given in Fig. 1 below. Each period corresponds to one year (At = 1). The yearly interest rate is r = 1/3 = 33%. This model is a CRR model. 25 15 9 10 6 4 time Figure 1: Stock evolution for Problem 1. (a) Find the values of up and down factors u and d, and the risk-neutral probability q. (b) We consider a European put with strike price K the price of this option at time 0. == 16 and expiration T = 2 years. Find (c) Provide the number of shares of stock that the replicating portfolio contains at each pos- sible position. (d) You find this option available on the market for $2. What do you do? (Short answer.) (e) We consider an American put with strike price K = 16 and expiration T = 2 years. Find the price of this option at time 0 and describe the optimal exercising strategy. (f) We consider an American call with strike price K ○ = 16 and expiration T = 2 years. Find the price of this option at time 0 and describe…arrow_forward2.2, 13.2-13.3) question: 5 point(s) possible ubmit test The accompanying table contains the data for the amounts (in oz) in cans of a certain soda. The cans are labeled to indicate that the contents are 20 oz of soda. Use the sign test and 0.05 significance level to test the claim that cans of this soda are filled so that the median amount is 20 oz. If the median is not 20 oz, are consumers being cheated? Click the icon to view the data. What are the null and alternative hypotheses? OA. Ho: Medi More Info H₁: Medi OC. Ho: Medi H₁: Medi Volume (in ounces) 20.3 20.1 20.4 Find the test stat 20.1 20.5 20.1 20.1 19.9 20.1 Test statistic = 20.2 20.3 20.3 20.1 20.4 20.5 Find the P-value 19.7 20.2 20.4 20.1 20.2 20.2 P-value= (R 19.9 20.1 20.5 20.4 20.1 20.4 Determine the p 20.1 20.3 20.4 20.2 20.3 20.4 Since the P-valu 19.9 20.2 19.9 Print Done 20 oz 20 oz 20 oz 20 oz ce that the consumers are being cheated.arrow_forwardT Teenage obesity (O), and weekly fast-food meals (F), among some selected Mississippi teenagers are: Name Obesity (lbs) # of Fast-foods per week Josh 185 10 Karl 172 8 Terry 168 9 Kamie Andy 204 154 12 6 (a) Compute the variance of Obesity, s²o, and the variance of fast-food meals, s², of this data. [Must show full work]. (b) Compute the Correlation Coefficient between O and F. [Must show full work]. (c) Find the Coefficient of Determination between O and F. [Must show full work]. (d) Obtain the Regression equation of this data. [Must show full work]. (e) Interpret your answers in (b), (c), and (d). (Full explanations required). Edit View Insert Format Tools Tablearrow_forward
arrow_back_ios
SEE MORE QUESTIONS
arrow_forward_ios
Recommended textbooks for you
 Glencoe Algebra 1, Student Edition, 9780079039897...AlgebraISBN:9780079039897Author:CarterPublisher:McGraw Hill
 Big Ideas Math A Bridge To Success Algebra 1: Stu...AlgebraISBN:9781680331141Author:HOUGHTON MIFFLIN HARCOURTPublisher:Houghton Mifflin Harcourt
 Holt Mcdougal Larson Pre-algebra: Student Edition...AlgebraISBN:9780547587776Author:HOLT MCDOUGALPublisher:HOLT MCDOUGAL
 Algebra: Structure And Method, Book 1AlgebraISBN:9780395977224Author:Richard G. Brown, Mary P. Dolciani, Robert H. Sorgenfrey, William L. ColePublisher:McDougal Littell
 Linear Algebra: A Modern IntroductionAlgebraISBN:9781285463247Author:David PoolePublisher:Cengage Learning
Glencoe Algebra 1, Student Edition, 9780079039897...
Algebra
ISBN:9780079039897
Author:Carter
Publisher:McGraw Hill
Big Ideas Math A Bridge To Success Algebra 1: Stu...
Algebra
ISBN:9781680331141
Author:HOUGHTON MIFFLIN HARCOURT
Publisher:Houghton Mifflin Harcourt
Holt Mcdougal Larson Pre-algebra: Student Edition...
Algebra
ISBN:9780547587776
Author:HOLT MCDOUGAL
Publisher:HOLT MCDOUGAL
Algebra: Structure And Method, Book 1
Algebra
ISBN:9780395977224
Author:Richard G. Brown, Mary P. Dolciani, Robert H. Sorgenfrey, William L. Cole
Publisher:McDougal Littell
Linear Algebra: A Modern Introduction
Algebra
ISBN:9781285463247
Author:David Poole
Publisher:Cengage Learning
Solve ANY Optimization Problem in 5 Steps w/ Examples. What are they and How do you solve them?; Author: Ace Tutors;https://www.youtube.com/watch?v=BfOSKc_sncg;License: Standard YouTube License, CC-BY
Types of solution in LPP|Basic|Multiple solution|Unbounded|Infeasible|GTU|Special case of LP problem; Author: Mechanical Engineering Management;https://www.youtube.com/watch?v=F-D2WICq8Sk;License: Standard YouTube License, CC-BY
Optimization Problems in Calculus; Author: Professor Dave Explains;https://www.youtube.com/watch?v=q1U6AmIa_uQ;License: Standard YouTube License, CC-BY
Introduction to Optimization; Author: Math with Dr. Claire;https://www.youtube.com/watch?v=YLzgYm2tN8E;License: Standard YouTube License, CC-BY