Concept explainers
Focal Length A refracting telescope has a main lens, or objective lens, and a second lens, the eyepiece (see Figure 3.42). For a given magnification
|
|
|
|
|
|
|
|
|
|
a. Construct a linear model for the data.
b. In this example, the magnification
c. Solve the equation you obtained in part b for
d. To achieve a large magnification, how should the objective and eyepiece lenses be selected?
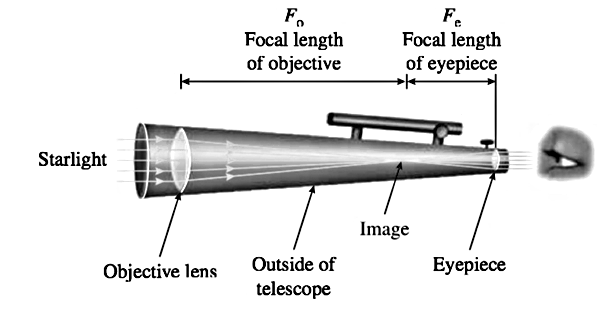
FIGURE 3.42
Trending nowThis is a popular solution!
Chapter 3 Solutions
Functions and Change: A Modeling Approach to College Algebra (MindTap Course List)
Additional Math Textbook Solutions
College Algebra (7th Edition)
Introduction to Linear Algebra (Classic Version) (5th Edition) (Pearson Modern Classics for Advanced Mathematics Series)
Beginning and Intermediate Algebra
College Algebra: Graphs and Models (6th Edition)
College Algebra (5th Edition)
Elementary & Intermediate Algebra
- We want to predict the selling price of a house in Newburg Park, Florida, based on the distance the house lies from the beach. Suppose that we're given the data in the table below. These data detail the distance from the beach (x, in miles) and the selling price (y, in thousands of dollars) for each of a sample of fifteen homes sold in Newburg Park in the past year. The data are plotted in the scatter plot in Figure 1. Also given is the product of the distance from the beach and the house price for each of the fifteen houses. (These products, written in the column labelled "xy", may aid in calculations.) Distance from the beach, x (in miles) Selling price, y (in thousands of dollars) xy 5.0 270.1 1350.5 11.5 205.9 2367.85 5.9 309.4 1825.46 12.2 200.6 2447.32 2.6 307.1 798.46 5.9 266.0 1569.4 8.3 297.3 2467.59 18.3 224.2 4102.86 6.5 242.4 1575.6 12.1 192.6 2330.46 11.6 229.4 2661.04 9.5 230.9 2193.55 10.1 277.0 2797.7 13.5 270.8 3655.8 6.2…arrow_forwardWe want to predict the selling price of a house in Newburg Park, Florida, based on the distance the house lies from the beach. Suppose that we're given the data in the table below. These data detail the distance from the beach (x, in miles) and the selling price (y, in thousands of dollars) for each of a sample of sixteen homes sold in Newburg Park in the past year. The data are plotted in the scatter plot in Figure 1. Also given is the product of the distance from the beach and the house price for each of the sixteen houses. (These products, written in the column labelled "xy", may aid in calculations.) Selling price, y (in thousands of dollars) 289.2 233.9 201.0 306.5 210.9 217.2 234.3 264.6 292.8 267.0 216.8 274.8 234.9 317.1 192.0 259.3 Distance from the beach, x (in miles) 10.7 9.2 13.7 5.8 7.7 17.4 11.4 9.8 6.9 6.9 9.9 5.6 7.5 4.2 14.3 14.2 Send data to calculator ху 3094.44 2151.88 2753.7 1777.7 1623.93 3779.28 2671.02 2593.08 2020.32 1842.3 2146.32 1538.88 1761.75 1331.82…arrow_forwardWe want to predict the selling price of a house in Newburg Park, Florida, based on the distance the house lies from the beach. Suppose that we're given the data in the table below. These data detail the distance from the beach (x, in miles) and the selling price (y, in thousands of dollars) for each of a sample of sixteen homes sold in Newburg Park in the past year. The data are plotted in the scatter plot in Figure 1. Also given are the products of the distances from the beach and house prices for each of the sixteen houses. (These products, written in the column labelled "xy," may aid in calculations.)arrow_forward
- We want to predict the selling price of a house in Newburg Park, Florida, based on the distance the house lies from the beach. Suppose that we're given the data in the table below. These data detail the distance from the beach (x, in miles) and the selling price (y, in thousands of dollars) for each of a sample of sixteen homes sold in Newburg Park in the past year. The data are plotted in the scatter plot in Figure 1. Also given is the product of the distance from the beach and the house price for each of the sixteen houses. (These products, written in the column labelled"xy", may aid in calculations.) Distance from the beach, x (in miles) Selling price, y (in thousands of dollars) xy 11.1 232.2 2577.42 8.8 293.5 2582.8 9.2 279.6 2572.32 12.3 276.2 3397.26 5.5 241.5 1328.25 5.3 303.8 1610.14 4.9 271.1 1328.39 13.9 188.6 2621.54 3.2 321.6 1029.12 10.0 212.1 2121 13.2 199.7 2636.04 15.2 259.5 3944.4 11.2 218.7 2449.44 5.3 275.2 1458.56…arrow_forwardWe want to predict the selling price of a house in Newburg Park, Florida, based on the distance the house lies from the beach. Suppose that we're given the data in the table below. These data detail the distance from the beach ( x , in miles) and the selling price ( y , in thousands of dollars) for each of a sample of sixteen homes sold in Newburg Park in the past year. The data are plotted in the scatter plot in Figure 1. Distance from the beach, x(in miles) Selling price, y(in thousands of dollars) 13.3 224.2 10.0 288.0 13.7 272.4 10.0 229.5 4.6 274.1 12.7 190.6 8.2 289.4 9.1 215.4 11.5 272.8 7.0 244.4 4.9 309.5 12.4 198.9 7.0 305.4 11.8 202.5 5.7 277.1 18.0 228.5 y 150 200 250 300 350 x 5 10 15 20 0 Figure 1 The value of the sample correlation coefficient r for these data is approximately −0.577 . Answer the…arrow_forwardWe want to predict the selling price of a house in Newburg Park, Florida, based on the distance the house lies from the beach. Suppose that we're given the data in the table below. These data detail the distance from the beach (x, in miles) and the selling price (y, in thousands of dollars) for each of a sample of sixteen homes sold in Newburg Park in the past year. The data are plotted in the scatter plot in Figure 1. Distance from the beach, x (in miles) 5.1 6.2 9.5 10.3 10.7 5.3 12.6 13.0 19.4 8.2 5.2 3.8 9.0 11.7 11.5 8.3 Send data to calculator V Selling price, y (in thousands of dollars) 263.5 274.6 238.6 223.7 267.1 306.2 202.5 267.7 217.3 224.7 241.0 312.0 284.6 210.9 185.6 294.2 Send data to Excel thousands of dollars) Selling price 350+ 300+ Figure 1 250 200 150. 0 Distance from the beach (in miles) Español F00 ? D 1 As Marrow_forward
- We want to predict the selling price of a house in Newburg Park, Florida, based on the distance the house lies from the beach. Suppose that we're given the data in the table below. These data detail the distance from the beach (x, in miles) and the selling price (y, in thousands of dollars) for each of a sample of sixteen homes sold in Newburg Park in the past year. The data are plotted in the scatter plot in Figure 1. Also given is the product of the distance from the beach and the house price for each of the sixteen houses. (These products, written in the column labelled "xy", may aid in calculations.) Distance from the beach, x (in miles) 7.7 18.5 6.3 11.9 11.0 14.6 11.3 3.0 Selling price, y (in thousands of dollars) 290.8 215.0 304.4 269.9 283.2 203.4 212.4 263.2 197.3 272.2 215.1 241.6 312.3 221.5 279.1 236.1 10.9 4.9 12.5 5.8 3.6 5.7 9.4 8.1 Send data to calculator xy 2239.16 3977.5 1917.72 3211.81 3115.2 2969.64 2400.12 789.6 2150.57 1333.78 2688.75 1401.28 1124.28 1262.55…arrow_forwardSTER. 1. Wine Consumption. The table below gives the U.S. adult wine consumption, in gallons per person per year, for selected years from 1980 to 2005. a) Create a scatterplot for the data. Graph the scatterplot Year Wine below. Consumption 2.6 b) Determine what type of model is appropriate for the 1980 data. 1985 2.3 c) Use the appropriate regression on your calculator to find a Graph the regression equation in the same coordinate plane below. d) According to your model, in what year was wine consumption at a minimum? A e) Use your model to predict the wine consumption in 2008. 1990 2.0 1995 2.1 2000 2.5 2005 2.8arrow_forwardThe table below shows the number of state-registered automatic weapons and the murder rate for several Northwestern states. 11.8 8.2 7.2 3.9 2.4 2.4 2.7 0.6 14.4 11.3 10.2 7.2 6.1 5.9 6.2 4.8 thousands of automatic weapons y = murders per 100,000 residents %3D This data can be modeled by the equation y = 0.88x + 3.95. Use this equation to answer the following; Special Note: I suggest you verify this equation by performing linear regression on your calculator. A) How many murders per 100,000 residents can be expected in a state with 7.6 thousand automatic weapons? Answer = Round to 3 decimal places. B) How many murders per 100,000 residents can be expected in a state with 9 thousand automatic weapons? Answer = Round to 3 decimal places.arrow_forward
- Here is a timeplot of each monthly load factor for domestic flights for 2002 to 2017 along with a lowess smooth Answer parts a and b. A Click the icon to view the timeplot. Timeplot a) Describe the patterns you see in this plot. O A. The load factors have been increasing at a constant rate. OB. The load factors have been decreasing at a constant rate 82.5 Oc. The load factors have been increasing steadily O D. The load factors have been decreasing steadily. 75.0 b) Do you expect the overall pattern to continue for another decade? Why or why not? 67.5 O A. No. These are percentages, so they can't exceed 100% Moreover, we have no reason to believe this trend will continue O B. No. These are percentages, so they can't exceed twice the beginning value. Moreover, we have no reason to believe this trend will continue 2004 2008 2012 2016 Decimal Year O C. Yes. These values can keep increasing for exactly another decade because these percentages cannot exceed the decade O D. Yes. These values…arrow_forward(c) Th Data Table Total Length (cm) 138.0 135.0 130.0 120.5 149.0 141.0 141.0 150.0 166.0 151.5 129.5 150.0 Print Weight (kg) 110 60 90 60 85 105 95 85 155 140 105 110 Done 0 X Critical Values for the Correlation Coefficient 3 0.997 4 0.950 5 0.878 6 0.811 7 0.754 8 0.707 9 0.666 10 0.632 11 0.602 12 0.576 13 0.553 14 0.532 15 0.514 16 0.497 17 0.482 18 0.468 19 0.456 20 0.444 21 0.433 22 0.423 23 0.413 24 0.404 25 0.396 26 0.388 27 0.381 0371 X not practical to v parts (a) througharrow_forwardThe table below shows the number of state-registered automatic weapons and the murder rate for several Northwestern states. x 11.5 8.5 6.7 3.8 2.6 2.5 2.3 0.4 y 13.9 11.4 9.5 7.1 6.3 6.2 6.1 4.2 x = thousands of automatic weaponsy = murders per 100,000 residents This data can be modeled by the equation y=0.86x+3.96. Use this equation to answer the following; Special Note: I suggest you verify this equation by performing linear regression on your calculator. A) How many murders per 100,000 residents can be expected in a state with 1.8 thousand automatic weapons? Answer = Round to 3 decimal places. B) How many murders per 100,000 residents can be expected in a state with 9.7 thousand automatic weapons? Answer = Round to 3 decimal places.arrow_forward
- Algebra & Trigonometry with Analytic GeometryAlgebraISBN:9781133382119Author:SwokowskiPublisher:CengageBig Ideas Math A Bridge To Success Algebra 1: Stu...AlgebraISBN:9781680331141Author:HOUGHTON MIFFLIN HARCOURTPublisher:Houghton Mifflin Harcourt
- Trigonometry (MindTap Course List)TrigonometryISBN:9781337278461Author:Ron LarsonPublisher:Cengage LearningGlencoe Algebra 1, Student Edition, 9780079039897...AlgebraISBN:9780079039897Author:CarterPublisher:McGraw HillFunctions and Change: A Modeling Approach to Coll...AlgebraISBN:9781337111348Author:Bruce Crauder, Benny Evans, Alan NoellPublisher:Cengage Learning