
Subpart (a):
Effect on Aggregate Demand and Supply.
Subpart (a):
Explanation of Solution
When consumers fear of an impending economic depression, their spending decline and they tend to save more. This leads to a decrease in AD curve. This can be explained by using figure 1.
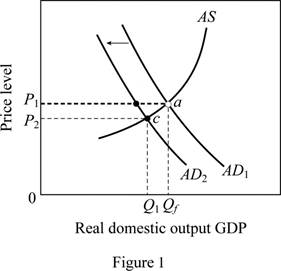
In figure 1, horizontal axis represents the real GDP(
Concept Introduction:
Aggregate demand (AD): Aggregate demand refers to the total value of the goods and services that are demanded at a particular price in a given period of time.
Subpart (b):
Effect on Aggregate Demand and Supply.
Subpart (b):
Explanation of Solution
When a new tax is imposed on producers, cost of production comes up and there is no incentive to produce more. This leads to a decline in
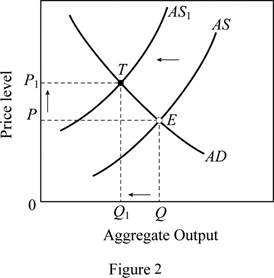
In figure 2, horizontal axis represents the real GDP and vertical axis represents price level. In this case, the AS curve shifts left (from AS to AS1), this moves the equilibrium position from E to T, thus there is a decline in the output (from Q to Q1) and a rise in the price level (from P to P1).
Concept Introduction:
Aggregate demand (AD): Aggregate demand refers to the total value of the goods and services that are demanded at a particular price in a given period of time.
Aggregate supply (AS): Aggregate supply refers to the total value of the goods and services that are available for purchase at a particular price in a given period of time.
Subpart (c):
Effect on Aggregate Demand and Supply.
Subpart (c):
Explanation of Solution
Figure 3 can explain the shift in AD curve due to reduction in interest rates at each price level. In figure 3, horizontal axis measures the real GDP and vertical axis measures the price level.
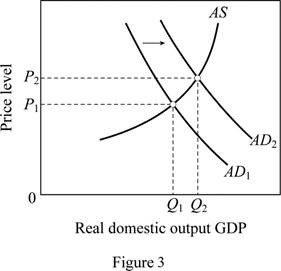
A reduction in interest rates decreases the borrowing cost increases the spending.
This leads to a rightward shift of AD curve from AD1 to AD2. Thus, it brings the output and price level up. The output increases from Q1 to Q2 and price level increases from P1 to P2.
Concept Introduction:
Aggregate demand (AD): Aggregate demand refers to the total value of the goods and services that are demanded at a particular price in a given period of time.
Aggregate supply (AS): Aggregate supply refers to the total value of the goods and services that are available for purchase at a particular price in a given period of time.
Subpart (d):
Effect on Aggregate Demand and Supply.
Subpart (d):
Explanation of Solution
A major increase in spending shifts the AD curve to right. Figure 4 is used to explain this situation. In figure 4, horizontal axis measures the real GDP and vertical axis measures the price level.
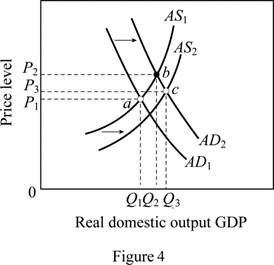
Government expenditure is a key determinant of changes in the aggregate demand. The increase in government spending (spending for health care) increases the aggregate demand leading to a shift of AD curve from AD1 to AD2. Any real improvements in healthcare resulting from the spending would ultimately increase the productivity, thereby shifting the AS curve to the right (from AS1 to AS2). The equilibrium moves from a to c leading to an increase in output (from Q1 to Q3) .It will also move the price level up from P1 to P3.
Concept Introduction:
Aggregate demand (AD): Aggregate demand refers to the total value of the goods and services that are demanded at a particular price in a given period of time.
Aggregate supply (AS): Aggregate supply refers to the total value of the goods and services that are available for purchase at a particular price in a given period of time.
Subpart (e):
Effect on Aggregate Demand and Supply.
Subpart (e):
Explanation of Solution
The general expectation of surging inflation in the near future will increase the aggregate demand today because the consumers will want to buy products before their prices escalate. This can be illustrated using figure 3. As a result, there will be a rightward shift of AD curve from AD1 to AD2 which brings the output and price level up. In figure 3, the output increases from Q1 to Q2 and price level increases from P1 to P2.
Concept Introduction:
Aggregate demand (AD): Aggregate demand refers to the total value of the goods and services that are demanded at a particular price in a given period of time.
Aggregate supply (AS): Aggregate supply refers to the total value of the goods and services that are available for purchase at a particular price in a given period of time.
Subpart (f):
Effect on Aggregate Demand and Supply.
Subpart (f):
Explanation of Solution
Figure 5 is used to explain this case. In figure 5, horizontal axis measures the real GDP and vertical axis measures the price level.
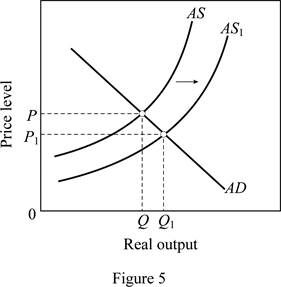
As oil prices fall (oil is an imported resource) due to the disintegration of OPEC, it increases the U.S. aggregate supply. As a result, there will be a rightward shift of AS curve from AS to AS1. This brings the output level up from Q to Q1 and price level down from P to P1.
Concept Introduction:
Aggregate demand (AD): Aggregate demand refers to the total value of the goods and services that are demanded at a particular price in a given period of time.
Aggregate supply (AS): Aggregate supply refers to the total value of the goods and services that are available for purchase at a particular price in a given period of time.
Subpart (g):
Effect on Aggregate Demand and Supply.
Subpart (g):
Explanation of Solution
A reduction in the personal income tax rates raises take-home income increases consumer purchases at each possible price level. This is illustrated in figure 3. Tax cuts shift the aggregate demand curve to the right from AD1 to AD2 which brings the output and price level up. In figure 3, the output increases from Q1 to Q2 and price level increases from P1 to P2.
Concept Introduction:
Aggregate demand (AD): Aggregate demand refers to the total value of the goods and services that are demanded at a particular price in a given period of time.
Aggregate supply (AS): Aggregate supply refers to the total value of the goods and services that are available for purchase at a particular price in a given period of time.
Subpart (h):
Effect on Aggregate Demand and Supply.
Subpart (h):
Explanation of Solution
The sizable increase the labor productivity with no change in nominal wages will increase the overall productivity as more output is available for the given input. This increases the aggregate supply thereby shifting the AS curve to the right from AS to AS1 (Refer Figure 5). This leads to an increase in output (from Q to Q1) and a decrease in price level from P to P1.
Concept Introduction:
Aggregate demand (AD): Aggregate demand refers to the total value of the goods and services that are demanded at a particular price in a given period of time.
Aggregate supply (AS): Aggregate supply refers to the total value of the goods and services that are available for purchase at a particular price in a given period of time.
Subpart (i):
Effect on Aggregate Demand and Supply.
Subpart (i):
Explanation of Solution
This case can be explained using Figure 2. When there is an increase in nominal wages with no change in productivity, it increases per unit cost of production. This force the AS curve to shift left (from AS to AS1). The equilibrium position moves from E to T, thus there are a decline in the output (from Q to Q1) and a rise in the price level (from P to P1).
Concept Introduction:
Aggregate demand (AD): Aggregate demand refers to the total value of the goods and services that are demanded at a particular price in a given period of time.
Aggregate supply (AS): Aggregate supply refers to the total value of the goods and services that are available for purchase at a particular price in a given period of time.
Subpart (j):
Effect on Aggregate Demand and Supply.
Subpart (j):
Explanation of Solution
Figure 6 shows the impact of increasing demand and decreasing supply.
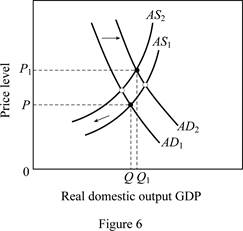
Figure 6 is used to explain this condition. The horizontal axis in Figure 6 measures the real domestic output whereas price level is measured by the vertical axis. A rise in net exports (higher exports relative to imports) shifts the aggregate demand curve to the right (from AD1 to AD2). But, due to the higher input prices, per unit cost is more, leading to a shift of the aggregate supply curve to the left from AS1 to AS2. This leads to an increase in output from Q to Q1 along with an increase in price level from P to P1.
Concept Introduction:
Aggregate demand (AD): Aggregate demand refers to the total value of the goods and services that are demanded at a particular price in a given period of time.
Aggregate supply (AS): Aggregate supply refers to the total value of the goods and services that are available for purchase at a particular price in a given period of time.
Want to see more full solutions like this?
Chapter 32 Solutions
ECO 2010 INCLUSIVE ACCESS

- Practice: Their labor forces are each capable of supplying four million hours per week that can be used to produce shorts, almonds, or some combination of the two. Country Shorts Almonds (Pairs per hour of labor) (Pounds per hour of labor) Everglades 4 16 Denali 5 10 Suppose that initially Denali uses 1 million hours of labor per week to produce shorts and 3 million hours per week to produce almonds, while Everglades uses 3 million hours of labor per week to produce shorts and 1 million hours per week to produce almonds. As a result, Everglades produces 12 million pairs of shorts and 16 million pounds of almonds, and Denali produces 5 million pairs of shorts and 30 million pounds of almonds. Assume there are no other countries willing to engage in trade, so, in the absence of trade between these two countries, each country consumes the amount of shorts and almonds it produces. Everglades's opportunity cost of producing 1 pair of shorts is4 pounds of…arrow_forwardQuestion #1. The Governor's budget Announcement from Decenbrer 2024. Review proposed resources for understanding the Governo's proposed FY25 Budget, provide a reflection focusing on initial thoughts and feeling on the prpposed budget for the state. Please provide APA citiatiion?arrow_forward#3. The Governor's Budget Announcement from December 2024. Review proposed resources for understanding the Governo's proposed FY25 Budget. Does the Governor's proposed budget impact the current Welfare State, Why or Why not?arrow_forward
- 3. Which is faster, red or green cars? You are a purchasing manager at a large car dealership in a busy urban area. You purchase on average 250 cars monthly for the dealership. People are buying new and used cars from your dealership regularly, and business is doing well. Most of your customers are average middle-income households, and they typically purchase bigger cars that are pricey. Your boss, Natalya, invited you for lunch to discuss the next big purchase in preparation for the big Summer sales event. While chatting about the business, Natalya told you the following: "While surfing social media today, I read a government report that says the economy is growing and inflation is rising. As the economy continues to grow due to an increase in consumption by consumers, the prices are expected to rise to a higher level than usual. The report also said that the increase in consumption has caused a shortage in the auto industry, which I think might be good for us (or bad, I don’t know.)…arrow_forward1. Homemade Lasagna and the Pursuit for Knowledge Your sister, Jamila, a newly appointed human resource manager at a fast-growing assisted living facility, was sitting with you at the dinner table. While you were enjoying a homemade Lasagna and watching TV together, a news report stated that "According to government officials, we are now headed into a recession that could last up to 10 months. The decline in economic activities is expected to affect all major industries." Your sister raised her eyebrows and showed an expression of confusion as she looked at you and stated, "Oh dear, what should I do now as an HR manager? My company is opening a large facility in a couple of months, and we need at least 60 people to run it. I oversee finding those people, but now I am afraid of doing so because it looks like the economy is in trouble. So, dear brother, help me understand a couple of things:" First, what on earth is a “recession”, and how does it affect the economy? Do things become…arrow_forwardConsider the simple discrete job search model that we studied in class. Only the unemployed can receive one offer per period from F(w) that is a uniform distribution on [0,2]. There is a constant probability of being laid off at the end of each period while employed. Assume that she can get a new offer right away when laid off. We want to understand the reservation wage, WR, in this model. Assume that u(c) = c. The parameters are a discount factor ẞ and an unemployment benefit b.R and show that T is contraction on [0, ∞). Explicitly state any additional assumptions that you may need.(Grading guide line: 5pt for the exact form of T, 10pt for showing contraction, and 5pt for stating correct assumptions.)< (b) Discuss why (a) is useful to understand the reservation wage wд in this economy.< (c) We write WR = WR (b,ẞ,λ) to reveal its dependence on (b,ẞ,λ). Show that 0 ≤ aWR дь OWR дл ≤1 and ≥0. What about ? awR ав State any additional assumptions that you may need.< (d) Briefly explain the…arrow_forward
- 3. Consider the market for paper. The process of producing paper creates pollution. Assume that the marginal damage function for pollution is given by: MDF = 3E where damages are measured in dollars and E is the level of emissions. Assume further that the function describing the marginal abatement cost of emissions is given by MAC 120-E where benefits are measured in dollars and E is the level of emissions. a. Graph the marginal damage function (MDF) and the marginal abatement cost function (MAC). b. What is the unregulated level of emissions Eu? What is the social welfare of this emissions level? c. Assume an existing emission quota limits emissions to E = 60. Show on the graph why this policy is inefficient. What is the deadweight loss caused by this policy?arrow_forwardshow written calculation for Barrow_forwardProblem 1: 1. If a stock is expected to pay an annual dividend of $20 forever, what is the approximate present value of the stock, given that the discount rate is 5%? 2. If a stock is expected to pay an annual dividend of $20 forever, what is the approximate present value of the stock, given that the discount rate is 8%? 3. If a stock is expected to pay an annual dividend of $20 this year, what is the approximate present value of the stock, given that the discount rate is 8% and dividends are expected to grow at a rate of 2% per year?arrow_forward
- d-farrow_forwardG please!arrow_forward4. Consider two polluting firms, with the marginal abatement costs of polluters 1 and 2, respectively, equal to MAC₁ = 20-E1 MAC2 = 12-E2 a. What is the unregulated level of pollution for each firm? b. Assume policymakers have decided to cut the level of pollution in half. The way they intend to accomplish this goal is to require both firms to cut their pollution in half. What are the total costs of abatement from the policy? And how are these costs distributed between the firms? c. Is this uniform quota on emissions across firms the most cost-effective manner in which to reduce emissions by 50%?arrow_forward
 Essentials of Economics (MindTap Course List)EconomicsISBN:9781337091992Author:N. Gregory MankiwPublisher:Cengage Learning
 Principles of Economics (MindTap Course List)EconomicsISBN:9781305585126Author:N. Gregory MankiwPublisher:Cengage Learning
 Principles of Macroeconomics (MindTap Course List)EconomicsISBN:9781285165912Author:N. Gregory MankiwPublisher:Cengage Learning
 Brief Principles of Macroeconomics (MindTap Cours...EconomicsISBN:9781337091985Author:N. Gregory MankiwPublisher:Cengage Learning
 Principles of Economics, 7th Edition (MindTap Cou...EconomicsISBN:9781285165875Author:N. Gregory MankiwPublisher:Cengage Learning
 Principles of Macroeconomics (MindTap Course List)EconomicsISBN:9781305971509Author:N. Gregory MankiwPublisher:Cengage Learning