
Concept explainers
Videos
What’s your favorite TV show? The following table presents the rating for the top 20 prime time shows for the 2007 -2008 season and for the 2012 -2013 season. The rating is the percentage of households with TV sets watched the program
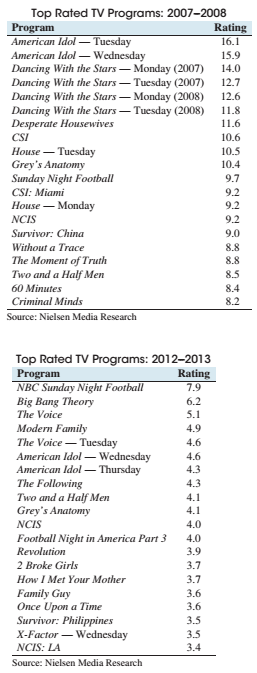
- Find the population standard deviation of the ratings for 2007—2008.
- Find the population standard deviation of the ratings for 2012—2013.
- Compute the
range for the ratings for both seasons. - Based on the standard deviations, did the spread in ratings increase or decrease over the two seasons?
- Based on the ranges, did the spread in ratings increase or decrease over the two seasons?
(a)
To find the population standard deviation for 2007 − 2008.
Answer to Problem 35E
The population standard deviation of the ratings for
Explanation of Solution
Given information:
Top Rated TV programs:
| Programs | Rating |
| American Idol −− Tuesday | |
| American Idol −− Wednesday | |
| Dancing With the Star −− Monday |
|
| Dancing With the Star −− Tuesday |
|
| Dancing With the Star −− Monday |
|
| Dancing With the Star −− Tuesday |
|
| Desperate Housewives | |
| CIS | |
| House −− Tuesday | |
| Grey’s Anatomy | |
| Sunday Night Football | |
| CIS: Miami | |
| House −− Monday | |
| NCIS | |
| Survivor: China | |
| Without a Trace | |
| The Moment of Truth | |
| Two and a Half Men | |
| |
|
| Criminal Minds | |
Top Rated TV Programs: 2012-2013
| Programs | Rating |
| NBC Sunday Night Football | 7.9 |
| Bing Bang Theory | 6.2 |
| The Voice | 5.1 |
| Modern Family | 4.9 |
| The Voice- Tuesday | 4.6 |
| American Idol -Wednesday | 4.6 |
| American Idol -Thursday | 4.3 |
| The Following | 4.3 |
| Two and a Half Men | 4.1 |
| Grey's Anatomy | 4.1 |
| NCIS | 4.0 |
| Football Night in American Part 3 | 4.0 |
| Revolution | 3.9 |
| 2 Broke Girls | 3.7 |
| How I Met Your Mother | 3.7 |
| Family Guy | 3.6 |
| Once Upon a Time | 3.6 |
| Survivor- Philippines | 3.5 |
| X-Factor - Wednesday | 3.5 |
| NCIS : LA | 3.4 |
Concept used:
Following steps of TI-83 calculator are used to calculate the population standard deviation.
- Click on STAT > Edit
- Enter the provided data in L1.
- Press STAT > CALC > 1-Var Stats
- Enter L1 by pressing 2nd and 1.
- Press Enter.
Calculation:
Using the above mentioned step of TI-83 calculator, the obtained output is:
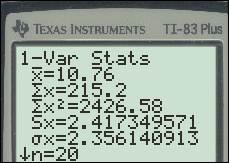
Thus, the population standard deviation
(b)
To calculate the population standard deviation for 2012 − 2013.
Answer to Problem 35E
The population standard deviation of the ratings for year
Explanation of Solution
Calculation:
Using the TI-83 calculator, the obtained output is:
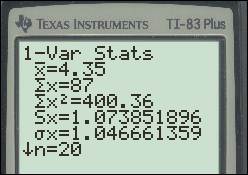
Thus, the population standard deviation of the ratings for
(c)
To calculate the range for both years.
Answer to Problem 35E
The range of the ratings for
The range of the ratings for
Explanation of Solution
The range of the set of data is the difference between the largest and smallest values of the data.
The range is calculated as:
The range of the ratings for the year 2007-2008 can be calculated as:
Similarly, the range of the ratings for the year 2012-2013 can be calculated as:
Thus, the range of the ratings for the years 2007-2008 and 2012-2013 are 7.9 and 4.5 respectively.
(d)
To explain whether the spread increases or decrease over the two seasons based on standard deviation.
Answer to Problem 35E
Yes, there is a decrease in spread ove.r the two seasons
Explanation of Solution
The population standard deviation of the ratings for
The population standard deviation of the ratings for
Based on the population standard deviation, the spread in ratings has decreased over the two seasons.
(e)
To explain whether the spread increase or decrease over the two seasons based on the range.
Answer to Problem 35E
Based on the ranges, the spread in ratings decrease over the two seasons
Explanation of Solution
The range of the ratings for
The range of the ratings for
Based on the ranges, the spread in ratings decrease over the two seasons
Want to see more full solutions like this?
Chapter 3 Solutions
Elementary Statistics 2nd Edition


- At the same restaurant as in Question 19 with the same normal distribution, what's the chance of it taking no more than 15 minutes to get service?arrow_forwardClint, obviously not in college, sleeps an average of 8 hours per night with a standard deviation of 15 minutes. What's the chance of him sleeping between 7.5 and 8.5 hours on any given night? 0-(7-0) 200 91109s and doiw $20 (8-0) mol 8520 slang $199 galbrog seam side pide & D (newid se od poyesvig as PELEO PER AFTE editiw noudab temand van Czarrow_forwardTimes to complete a statistics exam have a normal distribution with a mean of 40 minutes and standard deviation of 6 minutes. Deshawn's time comes in at the 90th percentile. What percentage of the students are still working on their exams when Deshawn leaves?arrow_forward
- Suppose that the weights of cereal boxes have a normal distribution with a mean of 20 ounces and standard deviation of half an ounce. A box that has a standard score of o weighs how much? syed by ilog ni 21arrow_forwardBob scores 80 on both his math exam (which has a mean of 70 and standard deviation of 10) and his English exam (which has a mean of 85 and standard deviation of 5). Find and interpret Bob's Z-scores on both exams to let him know which exam (if either) he did bet- ter on. Don't, however, let his parents know; let them think he's just as good at both subjects. algas 70) sering digarrow_forwardSue's math class exam has a mean of 70 with a standard deviation of 5. Her standard score is-2. What's her original exam score?arrow_forward
- Clint sleeps an average of 8 hours per night with a standard deviation of 15 minutes. What's the chance he will sleep less than 7.5 hours tonight? nut bow visarrow_forwardSuppose that your score on an exam is directly at the mean. What's your standard score?arrow_forwardOne state's annual rainfall has a normal dis- tribution with a mean of 100 inches and standard deviation of 25 inches. Suppose that corn grows best when the annual rainfall is between 100 and 150 inches. What's the chance of achieving this amount of rainfall? wved now of sociarrow_forward
- 13 Suppose that your exam score has a standard score of 0.90. Does this mean that 90 percent of the other exam scores are lower than yours?arrow_forwardBob's commuting times to work have a nor- mal distribution with a mean of 45 minutes and standard deviation of 10 minutes. How often does Bob get to work in 30 to 45 minutes?arrow_forwardBob's commuting times to work have a nor- mal distribution with a mean of 45 minutes and standard deviation of 10 minutes. a. What percentage of the time does Bob get to work in 30 minutes or less? b. Bob's workday starts at 9 a.m. If he leaves at 8 a.m., how often is he late?arrow_forward
 Big Ideas Math A Bridge To Success Algebra 1: Stu...AlgebraISBN:9781680331141Author:HOUGHTON MIFFLIN HARCOURTPublisher:Houghton Mifflin Harcourt
 Holt Mcdougal Larson Pre-algebra: Student Edition...AlgebraISBN:9780547587776Author:HOLT MCDOUGALPublisher:HOLT MCDOUGAL
 Glencoe Algebra 1, Student Edition, 9780079039897...AlgebraISBN:9780079039897Author:CarterPublisher:McGraw Hill