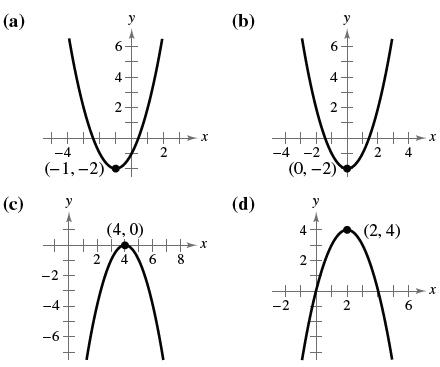
In Exercises 5-8, match the quadratic function with its graph. [ The graphs are labeled ( a ) , ( b ) , ( c ) , and ( d ) . ] f ( x ) = ( x + 1 ) 2 – 2
In Exercises 5-8, match the quadratic function with its graph. [ The graphs are labeled ( a ) , ( b ) , ( c ) , and ( d ) . ] f ( x ) = ( x + 1 ) 2 – 2
Solution Summary: The author explains that the graph of the quadratic function f(x) is a parabola whose axis of symmetry is the vertical line.
Let
2
A =
4
3
-4
0
1
(a) Show that v =
eigenvalue.
()
is an eigenvector of A and find the corresponding
(b) Find the characteristic polynomial of A and factorise it. Hint: the answer to (a)
may be useful.
(c) Determine all eigenvalues of A and find bases for the corresponding eigenspaces.
(d) Find an invertible matrix P and a diagonal matrix D such that P-¹AP = D.
(c) Let
6
0 0
A =
-10 4 8
5 1 2
(i) Find the characteristic polynomial of A and factorise it.
(ii) Determine all eigenvalues of A and find bases for the corresponding
eigenspaces.
(iii) Is A diagonalisable? Give reasons for your answer.
most 2, and let
Let P2 denote the vector space of polynomials of degree at
D: P2➡ P2
be the transformation that sends a polynomial p(t) = at² + bt+c in P2 to its derivative
p'(t)
2at+b, that is,
D(p) = p'.
(a) Prove that D is a linear transformation.
(b) Find a basis for the kernel ker(D) of the linear transformation D and compute its
nullity.
(c) Find a basis for the image im(D) of the linear transformation D and compute its
rank.
(d) Verify that the Rank-Nullity Theorem holds for the linear transformation D.
(e) Find the matrix representation of D in the standard basis (1,t, t2) of P2.
Chapter 3 Solutions
Bundle: College Algebra, Loose-leaf Version, 10th + WebAssign Printed Access Card for Larson's College Algebra, 10th Edition, Single-Term
Need a deep-dive on the concept behind this application? Look no further. Learn more about this topic, algebra and related others by exploring similar questions and additional content below.
RELATIONS-DOMAIN, RANGE AND CO-DOMAIN (RELATIONS AND FUNCTIONS CBSE/ ISC MATHS); Author: Neha Agrawal Mathematically Inclined;https://www.youtube.com/watch?v=u4IQh46VoU4;License: Standard YouTube License, CC-BY
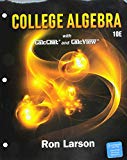


 Algebra and Trigonometry (MindTap Course List)AlgebraISBN:9781305071742Author:James Stewart, Lothar Redlin, Saleem WatsonPublisher:Cengage Learning
 College AlgebraAlgebraISBN:9781305115545Author:James Stewart, Lothar Redlin, Saleem WatsonPublisher:Cengage Learning
 Big Ideas Math A Bridge To Success Algebra 1: Stu...AlgebraISBN:9781680331141Author:HOUGHTON MIFFLIN HARCOURTPublisher:Houghton Mifflin Harcourt
 College Algebra (MindTap Course List)AlgebraISBN:9781305652231Author:R. David Gustafson, Jeff HughesPublisher:Cengage Learning