
Videos
A Quant jock from your firm used a linear demand specification to estimate the demand for its product and sent you a hard copy of the results. Unfortunately, some entries are missing because the toner was low in her printer. Use the information presented below to find the missing values labeled ‘1’ through ‘7’ (round your answers to the nearest hundredth). Then, answer the accompanying questions.
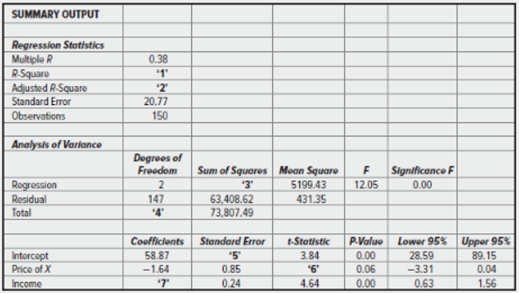
- Based on these estimates, write an equation that summarizes the demand for the firm’s product.
- Which regression coefficients are statistically significant at the 5 percent level?
- Comment on how well the regression line fits the data.
(a)
In the given table, the missing values that need to be found are:
- R-square
- Adjusted R-square
- Sum of Squares of regression
- Degree of freedom
- Standard error of Intercept
- t-statistic for price of X
- coefficient estimate of income.
To find the values of these missing terms, we need to go through the following steps:
1) R-square is computed as the ratio of the explained sum of squares of the regression to the total sum of squared errors. That is,
From the given information Sum of Squares of regression can be calculated,
The value of Sum of Squares is 10,398.87
By putting this value in formula of R-square, we get
The value of R-square is 0.141
2) The formula of adjusted R-square is:
Where r-square = 0.141
K= 3 and
n= 150
by putting these values in the formula, we get
Therefore, the value of the adjusted r-square is 0.129.
3) the value of Sum of Squares of regression is equal to 10,398.87.
4)the total degree of freedom is the sum of degree of freedom for regression and degree of freedom for residual.
Total degree of freedom = 147+2
= 149
Therefore, the value of the total degree of freedom is 149.
5) The standard error of intercept
In the table value of t-statistic and parameter, a is given. By putting these values in t-statistic formula we get,
Therefore, the value of the standard error of the intercept is equal to 15.33.
6) By using the value of coefficient and standard error we get t-statistic.
Therefore, the value of t-statistic for the price of X is equal to -1.93.
7)by using the same formula of t-statistic, the coefficient estimates of income can be found.
When we put the given information in the formula, we get
Therefore, the value of the coefficient estimate of income is equal to 1.1136.
Based on these estimates, the linear demand function of regression model.
Explanation of Solution
The demand function of is:
Here, Px is the price of good X and M is the income.
(b)
The estimates that are statistically different from zero.
Explanation of Solution
If the absolute value of the t-statistics is greater than or equal to 2, then the corresponding parameter estimate is statistically different from zero.
From the computed values and table, we have these details:
| t-statistic | |
| Intercept | 3.84 |
| Price of X | -1.93 |
| Income | 4.64 |
Since the absolute value of t-statistic for intercept and income is greater than 2, the estimated coefficient of the intercept and income at 5% significant level are statistically different from zero.
(c)
The question requires to find how well this model fit for the data.
Explanation of Solution
he values of R-square and adjusted r-square is the measurement of goodness of fit to a model. Here the value of adjusted r-square is not very different from the value of r-square. They are:
R-square = 0.141
Adjusted R-square = 0.129
The values of both the estimates are very small that means the regression equation is not able to explain the dependent variable values. Therefore, the regression line is not a good fit for the data.
Want to see more full solutions like this?
Chapter 3 Solutions
Managerial Economics & Business Strategy (Mcgraw-hill Series Economics)


- answerarrow_forwardDiscuss the preferred deterrent method employed by the Zambian government to combat tax evasion, monetary fines. As noted in the reading the potential penalty for corporate tax evasion is a fine of 52.5% of the amount evaded plus interest assessed at 5% annually along with a possibility of jail time. In general, monetary fines as a deterrent are preferred to blacklisting of company directors, revoking business operation licenses, or calling for prison sentences. Do you agree with this preference? Should companies that are guilty of tax evasion face something more severe than a monetary fine? Something less severe? Should the fine and interest amount be set at a different rate? If so at why? Provide support and rationale for your responses.arrow_forwardNot use ai pleasearrow_forward
- For the statement below, argue in position for both in favor or opposed to the statement. Incompetent leaders can't be ethical leaders. Traditional leadership theories and moral standards are not adequate to help employees solve complex organizational issues.arrow_forwardpresentation on "Dandelion Insomnia." Poemarrow_forwardDon't used Ai solutionarrow_forward
- "Whether the regulator sells or gives away tradeable emission permits free of charge, the quantities of emissions produced by firms are the same." Assume that there are n identical profit-maximising firms where profit for each firm is given by π(e) with л'(e) > 0; π"(e) < 0 and e denotes emissions. Individual emissions summed over all firms gives E which generates environmental damages D(E). Show that the regulator achieves the optimal level of total pollution through a tradeable emission permit scheme, where the permits are distributed according to the following cases: Case (i) the firm purchases all permits; Case (ii) the firm receives all permits free; and Page 3 of 5 ES30031 Case (iii) the firm purchases a portion of its permits and receives the remainder free of charge.arrow_forwardcompare and/or contrast the two plays we've been reading, Antigone and A Doll's House.arrow_forwardPlease answer step by steparrow_forward
- Suppose there are two firms 1 and 2, whose abatement costs are given by c₁ (e₁) and C2 (е2), where e denotes emissions and subscripts denote the firm. We assume that c{(e) 0 for i = 1,2 and for any level of emission e we have c₁'(e) # c₂' (e). Furthermore, assume the two firms make different contributions towards pollution concentration in a nearby river captured by the transfer coefficients ε₁ and 2 such that for any level of emission e we have C₂'(e) # The regulator does not know the resulting C₁'(e) Τι environmental damages. Using an analytical approach explain carefully how the regulator may limit the concentration of pollution using (i) a Pigouvian tax scheme and (ii) uniform emissions standards. Discuss the cost-effectiveness of both approaches to control pollution.arrow_forwardBill’s father read that each year a car’s value declines by 10%. He also read that a new car’s value declines by 12% as it is driven off the dealer’s lot. Maintenance costs and the costs of “car problems” are only $200 per year during the 2-year warranty period. Then they jump to $750 per year, with an annual increase of $500 per year.Bill’s dad wants to keep his annual cost of car ownership low. The car he prefers cost $30,000 new, and he uses an interest rate of 8%. For this car, the new vehicle warranty is transferrable.(a) If he buys the car new, what is the minimum cost life? What is the minimum EUAC?(b) If he buys the car after it is 2 years old, what is the minimum cost life? What is the minimum EUAC?(c) If he buys the car after it is 4 years old, what is the minimum cost life? What is the minimum EUAC?(d) If he buys the car after it is 6 years old, what is the minimum cost life? What is the minimum EUAC?(e) What strategy do you recommend? Why? Please show each step and formula,…arrow_forwardO’Leary Engineering Corp. has been depreciating a $50,000 machine for the last 3 years. The asset was just sold for 60% of its first cost. What is the size of the recaptured depreciation or loss at disposal using the following depreciation methods?(a) Straight-line with N = 8 and S = 2000(b) Double declining balance with N = 8(c) 40% bonus depreciation with the balance using 7-year MACRS Please show every step and formula, don't use excel. The answer should be (a) $2000 loss, (b) $8000 deo recap, (c) $14257 dep recap, thank you.arrow_forward
