
Statistics: The Art and Science of Learning from Data (4th Edition)
4th Edition
ISBN: 9780321997838
Author: Alan Agresti, Christine A. Franklin, Bernhard Klingenberg
Publisher: PEARSON
expand_more
expand_more
format_list_bulleted
Concept explainers
Videos
Textbook Question
Chapter 3, Problem 77CP
Care Weight and gas hogs: The table shows a short excerpt from the Car Weight and Mileage data file on the book’s website. That file lists several 2004 model cars with automatic transmission and their x = weight (in pounds) and y = mileage (miles per gallon of gas). The predication equation is
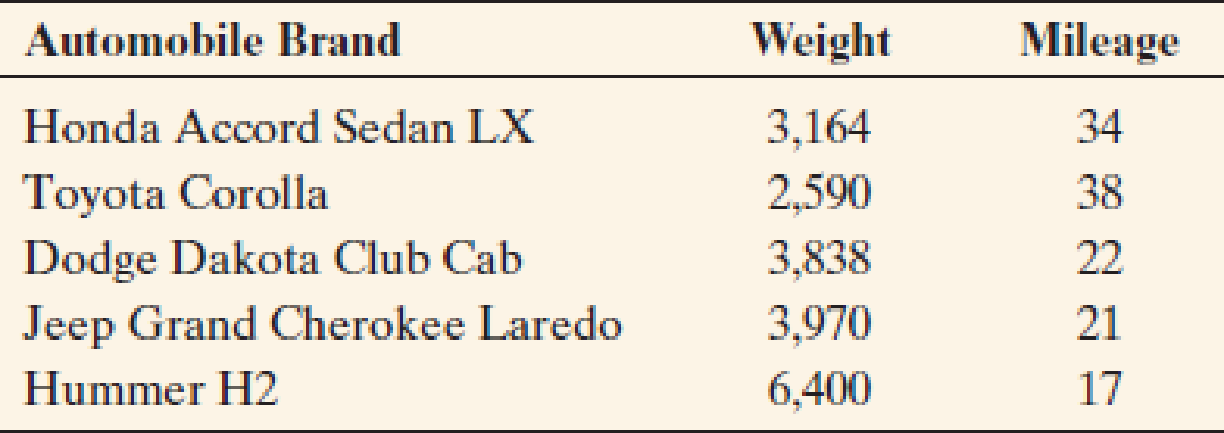
Sources: auto.consumerguide.com, honda.com, toyoto.com, landrover.com, ford.com.
- a. Interpret the slope in term of a 1000 pound increase in the vehicle weight.
- b. Find the predicated mileage and residual for a Hummer H2. Interpret.
Expert Solution & Answer
Want to see the full answer?
Check out a sample textbook solution
Students have asked these similar questions
A major company in the Montreal area, offering a range of engineering services from project preparation to construction execution, and industrial project management, wants to ensure that the individuals who are responsible for project cost estimation and bid preparation demonstrate a certain uniformity in their estimates. The head of civil engineering and municipal services decided to structure an experimental plan to detect if there could be significant differences in project evaluation.
Seven projects were selected, each of which had to be evaluated by each of the two estimators, with the order of the projects submitted being random. The obtained estimates are presented in the table below.
a) Complete the table above by calculating: i. The differences (A-B) ii. The sum of the differences iii. The mean of the differences iv. The standard deviation of the differences
b) What is the value of the t-statistic?
c) What is the critical t-value for this test at a significance level of 1%?…
Compute the relative risk of falling for the two groups (did not stop walking vs. did stop). State/interpret your result verbally.
Microsoft Excel include formulas
Chapter 3 Solutions
Statistics: The Art and Science of Learning from Data (4th Edition)
Ch. 3.1 - Which is the response/explanatory variable? For...Ch. 3.1 - Sales and advertising Each month, the owner of...Ch. 3.1 - Does higher income make you happy? Every General...Ch. 3.1 - Diamonds The clarity and cut of a diamond are two...Ch. 3.1 - Alcohol and college students The Harvard School of...Ch. 3.1 - How to fight terrorism? A survey of 1000 adult...Ch. 3.1 - Heaven and hell Two questions on the General...Ch. 3.1 - Prob. 8PBCh. 3.1 - Gender gap in party ID In recent election years,...Ch. 3.1 - Use the GSS Go to the GSS website...
Ch. 3.2 - Used cars and direction of association For the 100...Ch. 3.2 - Broadband and GDP The Internet Use data file on...Ch. 3.2 - Prob. 13PBCh. 3.2 - Politics and newspaper reading For the FL Student...Ch. 3.2 - Prob. 15PBCh. 3.2 - Match the scatterplot with r Match the following...Ch. 3.2 - Prob. 17PBCh. 3.2 - Prob. 18PBCh. 3.2 - Prob. 19PBCh. 3.2 - Prob. 20PBCh. 3.2 - Prob. 21PBCh. 3.2 - Prob. 22PBCh. 3.2 - Prob. 23PBCh. 3.3 - Sketch plots of lines Identify the values of the...Ch. 3.3 - Prob. 25PBCh. 3.3 - Home selling prices The House Selling Prices FL...Ch. 3.3 - Prob. 27PBCh. 3.3 - Prob. 28PBCh. 3.3 - Prob. 29PBCh. 3.3 - Broadband subscribers and population The Internet...Ch. 3.3 - Prob. 31PBCh. 3.3 - Prob. 32PBCh. 3.3 - Regression between cereal sodium and sugar The...Ch. 3.3 - Prob. 34PBCh. 3.3 - Advertising and sales Each month, the owner of...Ch. 3.3 - Midtermfinal correlation For students who take...Ch. 3.3 - Predict final exam from midterm In an introductory...Ch. 3.3 - NL baseball Example 9 related y = team scoring...Ch. 3.3 - Study time and college GPA A graduate teaching...Ch. 3.3 - Oil and GDP An article in the September 16, 2006,...Ch. 3.3 - Mountain bikes revisited Is there a relationship...Ch. 3.3 - Mountain bike and suspension type Refer to the...Ch. 3.3 - Fuel Consumption Most cars are fuel efficient when...Ch. 3.4 - Extrapolating murder The SPSS figure shows the...Ch. 3.4 - Mens Olympic long jumps The Olympic winning mens...Ch. 3.4 - U.S. average annual temperatures Use the U.S....Ch. 3.4 - Murder and education Example 13 found the...Ch. 3.4 - Murder and poverty For Table 3.6, the regression...Ch. 3.4 - TV watching and the birth rate The figure shows...Ch. 3.4 - Looking for outliers Using software, analyze the...Ch. 3.4 - Regression between cereal sodium and sugar Let x =...Ch. 3.4 - Gestational period and life expectancy Does the...Ch. 3.4 - Antidrug campaigns An Associated Press story (June...Ch. 3.4 - Whats wrong with regression? Explain whats wrong...Ch. 3.4 - Education causes crime? The table shows a small...Ch. 3.4 - Death penalty and race The table shows results of...Ch. 3.4 - NAEP scores Eighth-grade math scores on the...Ch. 3.4 - Age a confounder? A study observes that the...Ch. 3 - Choose explanatory and response For the following...Ch. 3 - Graphing data For each case in the previous...Ch. 3 - Life after death for males and females In a recent...Ch. 3 - God and happiness Go to the GSS website...Ch. 3 - Degrees and income The mean annual salaries earned...Ch. 3 - Bacteria in ground turkey Consumer Reports...Ch. 3 - Women managers in the work force The following...Ch. 3 - RateMyProfessor.com The website RateMyProfessors....Ch. 3 - Women in government and economic life The OECD...Ch. 3 - African droughts and dust Is there a relationship...Ch. 3 - Crime rate and urbanization For the data in...Ch. 3 - Gestational period and life expectancy revisited...Ch. 3 - Height and paycheck The headline of an article in...Ch. 3 - Predicting college GPA An admissions officer...Ch. 3 - College GPA = high school GPA Refer to the...Ch. 3 - Whats a college degree worth? In 2002, a census...Ch. 3 - Care Weight and gas hogs: The table shows a short...Ch. 3 - Predicting Internet use from cell phone use We now...Ch. 3 - Income depends on education? For a study of...Ch. 3 - Fertility and GDP Refer to the Human Development...Ch. 3 - Women working and birth rate Using data from...Ch. 3 - Education and income The regression equation for a...Ch. 3 - Income in euros Refer to the previous exercise....Ch. 3 - Changing units for cereal data Refer to the Cereal...Ch. 3 - Murder and single-parent families For Table 3.6 on...Ch. 3 - Violent crime and college education For the U.S....Ch. 3 - Violent crime and high school education Repeat the...Ch. 3 - Crime and urbanization For the U.S. Statewide...Ch. 3 - High school graduation rates and health insurance...Ch. 3 - Womens Olympic high jumps Example 11 discussed how...Ch. 3 - Income and height A survey of adults revealed a...Ch. 3 - More TV watching goes with fewer babies? For...Ch. 3 - More sleep causes death? An Associated Press story...Ch. 3 - Ask Marilyn Marilyn vos Savant writes a column for...Ch. 3 - Time studying and GPA Is there a relationship...Ch. 3 - Warming in Newnan, Georgia Access the Newnan GA...Ch. 3 - Fluoride and AIDS An Associated Press story...Ch. 3 - Fish fights Alzheimers An AP story (July 22, 2003)...Ch. 3 - Dogs make you healthier A study published in the...Ch. 3 - Multiple choice: Correlate GPA and GRE In a study...Ch. 3 - Multiple choice: Properties of r Which of the...Ch. 3 - Multiple choice: Interpreting r One can interpret...Ch. 3 - Multiple choice: Correct statement about r Which...Ch. 3 - Multiple choice: Describing association between...Ch. 3 - Multiple choice: Slope and correlation The slope...Ch. 3 - Multiple choice: Interpretation of r2 An r2...Ch. 3 - True or false The variables y = annual income...Ch. 3 - Correlation doesnt depend on units Suppose you...Ch. 3 - When correlation = slope Consider the formula...Ch. 3 - Center of the data Consider the formula a=ybx for...Ch. 3 - Final exam regresses toward mean of midterm Let y...Ch. 3 - Activity: Guess the correlation The Guess the...
Knowledge Booster


Learn more about
Need a deep-dive on the concept behind this application? Look no further. Learn more about this topic, statistics and related others by exploring similar questions and additional content below.Similar questions
- Question 1 The data shown in Table 1 are and R values for 24 samples of size n = 5 taken from a process producing bearings. The measurements are made on the inside diameter of the bearing, with only the last three decimals recorded (i.e., 34.5 should be 0.50345). Table 1: Bearing Diameter Data Sample Number I R Sample Number I R 1 34.5 3 13 35.4 8 2 34.2 4 14 34.0 6 3 31.6 4 15 37.1 5 4 31.5 4 16 34.9 7 5 35.0 5 17 33.5 4 6 34.1 6 18 31.7 3 7 32.6 4 19 34.0 8 8 33.8 3 20 35.1 9 34.8 7 21 33.7 2 10 33.6 8 22 32.8 1 11 31.9 3 23 33.5 3 12 38.6 9 24 34.2 2 (a) Set up and R charts on this process. Does the process seem to be in statistical control? If necessary, revise the trial control limits. [15 pts] (b) If specifications on this diameter are 0.5030±0.0010, find the percentage of nonconforming bearings pro- duced by this process. Assume that diameter is normally distributed. [10 pts] 1arrow_forward4. (5 pts) Conduct a chi-square contingency test (test of independence) to assess whether there is an association between the behavior of the elderly person (did not stop to talk, did stop to talk) and their likelihood of falling. Below, please state your null and alternative hypotheses, calculate your expected values and write them in the table, compute the test statistic, test the null by comparing your test statistic to the critical value in Table A (p. 713-714) of your textbook and/or estimating the P-value, and provide your conclusions in written form. Make sure to show your work. Did not stop walking to talk Stopped walking to talk Suffered a fall 12 11 Totals 23 Did not suffer a fall | 2 Totals 35 37 14 46 60 Tarrow_forwardQuestion 2 Parts manufactured by an injection molding process are subjected to a compressive strength test. Twenty samples of five parts each are collected, and the compressive strengths (in psi) are shown in Table 2. Table 2: Strength Data for Question 2 Sample Number x1 x2 23 x4 x5 R 1 83.0 2 88.6 78.3 78.8 3 85.7 75.8 84.3 81.2 78.7 75.7 77.0 71.0 84.2 81.0 79.1 7.3 80.2 17.6 75.2 80.4 10.4 4 80.8 74.4 82.5 74.1 75.7 77.5 8.4 5 83.4 78.4 82.6 78.2 78.9 80.3 5.2 File Preview 6 75.3 79.9 87.3 89.7 81.8 82.8 14.5 7 74.5 78.0 80.8 73.4 79.7 77.3 7.4 8 79.2 84.4 81.5 86.0 74.5 81.1 11.4 9 80.5 86.2 76.2 64.1 80.2 81.4 9.9 10 75.7 75.2 71.1 82.1 74.3 75.7 10.9 11 80.0 81.5 78.4 73.8 78.1 78.4 7.7 12 80.6 81.8 79.3 73.8 81.7 79.4 8.0 13 82.7 81.3 79.1 82.0 79.5 80.9 3.6 14 79.2 74.9 78.6 77.7 75.3 77.1 4.3 15 85.5 82.1 82.8 73.4 71.7 79.1 13.8 16 78.8 79.6 80.2 79.1 80.8 79.7 2.0 17 82.1 78.2 18 84.5 76.9 75.5 83.5 81.2 19 79.0 77.8 20 84.5 73.1 78.2 82.1 79.2 81.1 7.6 81.2 84.4 81.6 80.8…arrow_forward
- Name: Lab Time: Quiz 7 & 8 (Take Home) - due Wednesday, Feb. 26 Contingency Analysis (Ch. 9) In lab 5, part 3, you will create a mosaic plot and conducted a chi-square contingency test to evaluate whether elderly patients who did not stop walking to talk (vs. those who did stop) were more likely to suffer a fall in the next six months. I have tabulated the data below. Answer the questions below. Please show your calculations on this or a separate sheet. Did not stop walking to talk Stopped walking to talk Totals Suffered a fall Did not suffer a fall Totals 12 11 23 2 35 37 14 14 46 60 Quiz 7: 1. (2 pts) Compute the odds of falling for each group. Compute the odds ratio for those who did not stop walking vs. those who did stop walking. Interpret your result verbally.arrow_forwardSolve please and thank you!arrow_forward7. In a 2011 article, M. Radelet and G. Pierce reported a logistic prediction equation for the death penalty verdicts in North Carolina. Let Y denote whether a subject convicted of murder received the death penalty (1=yes), for the defendant's race h (h1, black; h = 2, white), victim's race i (i = 1, black; i = 2, white), and number of additional factors j (j = 0, 1, 2). For the model logit[P(Y = 1)] = a + ß₁₂ + By + B²², they reported = -5.26, D â BD = 0, BD = 0.17, BY = 0, BY = 0.91, B = 0, B = 2.02, B = 3.98. (a) Estimate the probability of receiving the death penalty for the group most likely to receive it. [4 pts] (b) If, instead, parameters used constraints 3D = BY = 35 = 0, report the esti- mates. [3 pts] h (c) If, instead, parameters used constraints Σ₁ = Σ₁ BY = Σ; B = 0, report the estimates. [3 pts] Hint the probabilities, odds and odds ratios do not change with constraints.arrow_forward
- Solve please and thank you!arrow_forwardSolve please and thank you!arrow_forwardQuestion 1:We want to evaluate the impact on the monetary economy for a company of two types of strategy (competitive strategy, cooperative strategy) adopted by buyers.Competitive strategy: strategy characterized by firm behavior aimed at obtaining concessions from the buyer.Cooperative strategy: a strategy based on a problem-solving negotiating attitude, with a high level of trust and cooperation.A random sample of 17 buyers took part in a negotiation experiment in which 9 buyers adopted the competitive strategy, and the other 8 the cooperative strategy. The savings obtained for each group of buyers are presented in the pdf that i sent: For this problem, we assume that the samples are random and come from two normal populations of unknown but equal variances.According to the theory, the average saving of buyers adopting a competitive strategy will be lower than that of buyers adopting a cooperative strategy.a) Specify the population identifications and the hypotheses H0 and H1…arrow_forward
- You assume that the annual incomes for certain workers are normal with a mean of $28,500 and a standard deviation of $2,400. What’s the chance that a randomly selected employee makes more than $30,000?What’s the chance that 36 randomly selected employees make more than $30,000, on average?arrow_forwardWhat’s the chance that a fair coin comes up heads more than 60 times when you toss it 100 times?arrow_forwardSuppose that you have a normal population of quiz scores with mean 40 and standard deviation 10. Select a random sample of 40. What’s the chance that the mean of the quiz scores won’t exceed 45?Select one individual from the population. What’s the chance that his/her quiz score won’t exceed 45?arrow_forward
arrow_back_ios
SEE MORE QUESTIONS
arrow_forward_ios
Recommended textbooks for you
 Holt Mcdougal Larson Pre-algebra: Student Edition...AlgebraISBN:9780547587776Author:HOLT MCDOUGALPublisher:HOLT MCDOUGAL
 Glencoe Algebra 1, Student Edition, 9780079039897...AlgebraISBN:9780079039897Author:CarterPublisher:McGraw Hill
Holt Mcdougal Larson Pre-algebra: Student Edition...
Algebra
ISBN:9780547587776
Author:HOLT MCDOUGAL
Publisher:HOLT MCDOUGAL
Glencoe Algebra 1, Student Edition, 9780079039897...
Algebra
ISBN:9780079039897
Author:Carter
Publisher:McGraw Hill
Correlation Vs Regression: Difference Between them with definition & Comparison Chart; Author: Key Differences;https://www.youtube.com/watch?v=Ou2QGSJVd0U;License: Standard YouTube License, CC-BY
Correlation and Regression: Concepts with Illustrative examples; Author: LEARN & APPLY : Lean and Six Sigma;https://www.youtube.com/watch?v=xTpHD5WLuoA;License: Standard YouTube License, CC-BY