
Statistics: The Art and Science of Learning from Data (4th Edition)
4th Edition
ISBN: 9780321997838
Author: Alan Agresti, Christine A. Franklin, Bernhard Klingenberg
Publisher: PEARSON
expand_more
expand_more
format_list_bulleted
Concept explainers
Videos
Textbook Question
Chapter 3.3, Problem 43PB
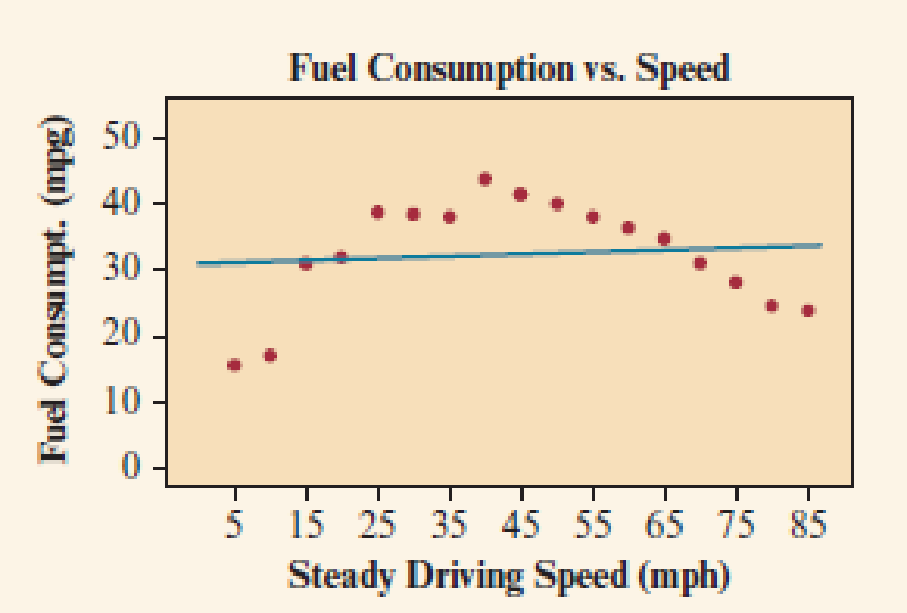
Fuel Consumption Most cars are fuel efficient when running at a steady speed of around 40 to 50 mph. A
- a. The
correlation equals 0.106. Comment on the use of thecorrelation coefficient as a measure for the association between fuel consumption and steady driving speed. - b. Comment on the use of the regression equation as a tool for predicting fuel consumption from the velocity of the car.
- c. Over what subrange of steady driving speed might fitting a regression equation be appropriate? Why?
Expert Solution & Answer
Want to see the full answer?
Check out a sample textbook solution
Students have asked these similar questions
For the distribution shown, match the letter to the measure of central tendency.
A B C
C
Drag each of the letters into the appropriate measure of central tendency.
Mean
C
Median
A
Mode
B
A physician who has a group of 38 female patients aged 18 to 24 on a special diet wishes to estimate the effect of the diet on total serum cholesterol. For this group, their average serum cholesterol is 188.4 (measured in mg/100mL). Suppose that the total serum cholesterol measurements are normally distributed with standard deviation of 40.7. (a) Find a 95% confidence interval of the mean serum cholesterol of patients on the special diet.
The accompanying data represent the weights (in grams) of a simple random sample of 10 M&M plain candies. Determine the shape of the distribution of weights of M&Ms by drawing a frequency
histogram. Find the mean and median. Which measure of central tendency better describes the weight of a plain M&M?
Click the icon to view the candy weight data.
Draw a frequency histogram. Choose the correct graph below.
○ A.
○ C.
Frequency
Weight of Plain M and Ms
0.78
0.84
Frequency
OONAG
0.78
B.
0.9
0.96
Weight (grams)
Weight of Plain M and Ms
0.84
0.9
0.96
Weight (grams)
○ D.
Candy Weights
0.85 0.79 0.85 0.89 0.94
0.86 0.91 0.86 0.87 0.87
-
Frequency
☑
Frequency
67200
0.78
→
Weight of Plain M and Ms
0.9
0.96
0.84
Weight (grams)
Weight of Plain M and Ms
0.78
0.84
Weight (grams)
0.9
0.96
→
Chapter 3 Solutions
Statistics: The Art and Science of Learning from Data (4th Edition)
Ch. 3.1 - Which is the response/explanatory variable? For...Ch. 3.1 - Sales and advertising Each month, the owner of...Ch. 3.1 - Does higher income make you happy? Every General...Ch. 3.1 - Diamonds The clarity and cut of a diamond are two...Ch. 3.1 - Alcohol and college students The Harvard School of...Ch. 3.1 - How to fight terrorism? A survey of 1000 adult...Ch. 3.1 - Heaven and hell Two questions on the General...Ch. 3.1 - Prob. 8PBCh. 3.1 - Gender gap in party ID In recent election years,...Ch. 3.1 - Use the GSS Go to the GSS website...
Ch. 3.2 - Used cars and direction of association For the 100...Ch. 3.2 - Broadband and GDP The Internet Use data file on...Ch. 3.2 - Prob. 13PBCh. 3.2 - Politics and newspaper reading For the FL Student...Ch. 3.2 - Prob. 15PBCh. 3.2 - Match the scatterplot with r Match the following...Ch. 3.2 - Prob. 17PBCh. 3.2 - Prob. 18PBCh. 3.2 - Prob. 19PBCh. 3.2 - Prob. 20PBCh. 3.2 - Prob. 21PBCh. 3.2 - Prob. 22PBCh. 3.2 - Prob. 23PBCh. 3.3 - Sketch plots of lines Identify the values of the...Ch. 3.3 - Prob. 25PBCh. 3.3 - Home selling prices The House Selling Prices FL...Ch. 3.3 - Prob. 27PBCh. 3.3 - Prob. 28PBCh. 3.3 - Prob. 29PBCh. 3.3 - Broadband subscribers and population The Internet...Ch. 3.3 - Prob. 31PBCh. 3.3 - Prob. 32PBCh. 3.3 - Regression between cereal sodium and sugar The...Ch. 3.3 - Prob. 34PBCh. 3.3 - Advertising and sales Each month, the owner of...Ch. 3.3 - Midtermfinal correlation For students who take...Ch. 3.3 - Predict final exam from midterm In an introductory...Ch. 3.3 - NL baseball Example 9 related y = team scoring...Ch. 3.3 - Study time and college GPA A graduate teaching...Ch. 3.3 - Oil and GDP An article in the September 16, 2006,...Ch. 3.3 - Mountain bikes revisited Is there a relationship...Ch. 3.3 - Mountain bike and suspension type Refer to the...Ch. 3.3 - Fuel Consumption Most cars are fuel efficient when...Ch. 3.4 - Extrapolating murder The SPSS figure shows the...Ch. 3.4 - Mens Olympic long jumps The Olympic winning mens...Ch. 3.4 - U.S. average annual temperatures Use the U.S....Ch. 3.4 - Murder and education Example 13 found the...Ch. 3.4 - Murder and poverty For Table 3.6, the regression...Ch. 3.4 - TV watching and the birth rate The figure shows...Ch. 3.4 - Looking for outliers Using software, analyze the...Ch. 3.4 - Regression between cereal sodium and sugar Let x =...Ch. 3.4 - Gestational period and life expectancy Does the...Ch. 3.4 - Antidrug campaigns An Associated Press story (June...Ch. 3.4 - Whats wrong with regression? Explain whats wrong...Ch. 3.4 - Education causes crime? The table shows a small...Ch. 3.4 - Death penalty and race The table shows results of...Ch. 3.4 - NAEP scores Eighth-grade math scores on the...Ch. 3.4 - Age a confounder? A study observes that the...Ch. 3 - Choose explanatory and response For the following...Ch. 3 - Graphing data For each case in the previous...Ch. 3 - Life after death for males and females In a recent...Ch. 3 - God and happiness Go to the GSS website...Ch. 3 - Degrees and income The mean annual salaries earned...Ch. 3 - Bacteria in ground turkey Consumer Reports...Ch. 3 - Women managers in the work force The following...Ch. 3 - RateMyProfessor.com The website RateMyProfessors....Ch. 3 - Women in government and economic life The OECD...Ch. 3 - African droughts and dust Is there a relationship...Ch. 3 - Crime rate and urbanization For the data in...Ch. 3 - Gestational period and life expectancy revisited...Ch. 3 - Height and paycheck The headline of an article in...Ch. 3 - Predicting college GPA An admissions officer...Ch. 3 - College GPA = high school GPA Refer to the...Ch. 3 - Whats a college degree worth? In 2002, a census...Ch. 3 - Care Weight and gas hogs: The table shows a short...Ch. 3 - Predicting Internet use from cell phone use We now...Ch. 3 - Income depends on education? For a study of...Ch. 3 - Fertility and GDP Refer to the Human Development...Ch. 3 - Women working and birth rate Using data from...Ch. 3 - Education and income The regression equation for a...Ch. 3 - Income in euros Refer to the previous exercise....Ch. 3 - Changing units for cereal data Refer to the Cereal...Ch. 3 - Murder and single-parent families For Table 3.6 on...Ch. 3 - Violent crime and college education For the U.S....Ch. 3 - Violent crime and high school education Repeat the...Ch. 3 - Crime and urbanization For the U.S. Statewide...Ch. 3 - High school graduation rates and health insurance...Ch. 3 - Womens Olympic high jumps Example 11 discussed how...Ch. 3 - Income and height A survey of adults revealed a...Ch. 3 - More TV watching goes with fewer babies? For...Ch. 3 - More sleep causes death? An Associated Press story...Ch. 3 - Ask Marilyn Marilyn vos Savant writes a column for...Ch. 3 - Time studying and GPA Is there a relationship...Ch. 3 - Warming in Newnan, Georgia Access the Newnan GA...Ch. 3 - Fluoride and AIDS An Associated Press story...Ch. 3 - Fish fights Alzheimers An AP story (July 22, 2003)...Ch. 3 - Dogs make you healthier A study published in the...Ch. 3 - Multiple choice: Correlate GPA and GRE In a study...Ch. 3 - Multiple choice: Properties of r Which of the...Ch. 3 - Multiple choice: Interpreting r One can interpret...Ch. 3 - Multiple choice: Correct statement about r Which...Ch. 3 - Multiple choice: Describing association between...Ch. 3 - Multiple choice: Slope and correlation The slope...Ch. 3 - Multiple choice: Interpretation of r2 An r2...Ch. 3 - True or false The variables y = annual income...Ch. 3 - Correlation doesnt depend on units Suppose you...Ch. 3 - When correlation = slope Consider the formula...Ch. 3 - Center of the data Consider the formula a=ybx for...Ch. 3 - Final exam regresses toward mean of midterm Let y...Ch. 3 - Activity: Guess the correlation The Guess the...
Knowledge Booster


Learn more about
Need a deep-dive on the concept behind this application? Look no further. Learn more about this topic, statistics and related others by exploring similar questions and additional content below.Similar questions
- The acidity or alkalinity of a solution is measured using pH. A pH less than 7 is acidic; a pH greater than 7 is alkaline. The accompanying data represent the pH in samples of bottled water and tap water. Complete parts (a) and (b). Click the icon to view the data table. (a) Determine the mean, median, and mode pH for each type of water. Comment on the differences between the two water types. Select the correct choice below and fill in any answer boxes in your choice. A. For tap water, the mean pH is (Round to three decimal places as needed.) B. The mean does not exist. Data table Тар 7.64 7.45 7.45 7.10 7.46 7.50 7.68 7.69 7.56 7.46 7.52 7.46 5.15 5.09 5.31 5.20 4.78 5.23 Bottled 5.52 5.31 5.13 5.31 5.21 5.24 - ☑arrow_forwardく Chapter 5-Section 1 Homework X MindTap - Cengage Learning x + C webassign.net/web/Student/Assignment-Responses/submit?pos=3&dep=36701632&tags=autosave #question3874894_3 M Gmail 品 YouTube Maps 5. [-/20 Points] DETAILS MY NOTES BBUNDERSTAT12 5.1.020. ☆ B Verify it's you Finish update: All Bookmarks PRACTICE ANOTHER A computer repair shop has two work centers. The first center examines the computer to see what is wrong, and the second center repairs the computer. Let x₁ and x2 be random variables representing the lengths of time in minutes to examine a computer (✗₁) and to repair a computer (x2). Assume x and x, are independent random variables. Long-term history has shown the following times. 01 Examine computer, x₁₁ = 29.6 minutes; σ₁ = 8.1 minutes Repair computer, X2: μ₂ = 92.5 minutes; σ2 = 14.5 minutes (a) Let W = x₁ + x2 be a random variable representing the total time to examine and repair the computer. Compute the mean, variance, and standard deviation of W. (Round your answers…arrow_forwardThe acidity or alkalinity of a solution is measured using pH. A pH less than 7 is acidic; a pH greater than 7 is alkaline. The accompanying data represent the pH in samples of bottled water and tap water. Complete parts (a) and (b). Click the icon to view the data table. (a) Determine the mean, median, and mode pH for each type of water. Comment on the differences between the two water types. Select the correct choice below and fill in any answer boxes in your choice. A. For tap water, the mean pH is (Round to three decimal places as needed.) B. The mean does not exist. Data table Тар Bottled 7.64 7.45 7.46 7.50 7.68 7.45 7.10 7.56 7.46 7.52 5.15 5.09 5.31 5.20 4.78 5.52 5.31 5.13 5.31 5.21 7.69 7.46 5.23 5.24 Print Done - ☑arrow_forward
- The median for the given set of six ordered data values is 29.5. 9 12 23 41 49 What is the missing value? The missing value is ☐.arrow_forwardFind the population mean or sample mean as indicated. Sample: 22, 18, 9, 6, 15 □ Select the correct choice below and fill in the answer box to complete your choice. O A. x= B. μεarrow_forwardWhy the correct answer is letter A? Students in an online course are each randomly assigned to receive either standard practice exercises or adaptivepractice exercises. For the adaptive practice exercises, the next question asked is determined by whether the studentgot the previous question correct. The teacher of the course wants to determine whether there is a differencebetween the two practice exercise types by comparing the proportion of students who pass the course from eachgroup. The teacher plans to test the null hypothesis that versus the alternative hypothesis , whererepresents the proportion of students who would pass the course using standard practice exercises andrepresents the proportion of students who would pass the course using adaptive practice exercises.The teacher knows that the percent confidence interval for the difference in proportion of students passing thecourse for the two practice exercise types (standard minus adaptive) is and the percent…arrow_forward
- Carpetland salespersons average $8,000 per week in sales. Steve Contois, the firm's vice president, proposes a compensation plan with new selling incentives. Steve hopes that the results of a trial selling period will enable him to conclude that the compensation plan increases the average sales per salesperson. a. Develop the appropriate null and alternative hypotheses.H 0: H a:arrow_forwardتوليد تمرين شامل حول الانحدار الخطي المتعدد بطريقة المربعات الصغرىarrow_forwardThe U.S. Postal Service will ship a Priority Mail® Large Flat Rate Box (12" 3 12" 3 5½") any where in the United States for a fixed price, regardless of weight. The weights (ounces) of 20 ran domly chosen boxes are shown below. (a) Make a stem-and-leaf diagram. (b) Make a histogram. (c) Describe the shape of the distribution. Weights 72 86 28 67 64 65 45 86 31 32 39 92 90 91 84 62 80 74 63 86arrow_forward
- (a) What is a bimodal histogram? (b) Explain the difference between left-skewed, symmetric, and right-skewed histograms. (c) What is an outlierarrow_forward(a) Test the hypothesis. Consider the hypothesis test Ho = : against H₁o < 02. Suppose that the sample sizes aren₁ = 7 and n₂ = 13 and that $² = 22.4 and $22 = 28.2. Use α = 0.05. Ho is not ✓ rejected. 9-9 IV (b) Find a 95% confidence interval on of 102. Round your answer to two decimal places (e.g. 98.76).arrow_forwardLet us suppose we have some article reported on a study of potential sources of injury to equine veterinarians conducted at a university veterinary hospital. Forces on the hand were measured for several common activities that veterinarians engage in when examining or treating horses. We will consider the forces on the hands for two tasks, lifting and using ultrasound. Assume that both sample sizes are 6, the sample mean force for lifting was 6.2 pounds with standard deviation 1.5 pounds, and the sample mean force for using ultrasound was 6.4 pounds with standard deviation 0.3 pounds. Assume that the standard deviations are known. Suppose that you wanted to detect a true difference in mean force of 0.25 pounds on the hands for these two activities. Under the null hypothesis, 40 = 0. What level of type II error would you recommend here? Round your answer to four decimal places (e.g. 98.7654). Use a = 0.05. β = i What sample size would be required? Assume the sample sizes are to be equal.…arrow_forward
arrow_back_ios
SEE MORE QUESTIONS
arrow_forward_ios
Recommended textbooks for you
 Glencoe Algebra 1, Student Edition, 9780079039897...AlgebraISBN:9780079039897Author:CarterPublisher:McGraw Hill
 Big Ideas Math A Bridge To Success Algebra 1: Stu...AlgebraISBN:9781680331141Author:HOUGHTON MIFFLIN HARCOURTPublisher:Houghton Mifflin Harcourt
 Holt Mcdougal Larson Pre-algebra: Student Edition...AlgebraISBN:9780547587776Author:HOLT MCDOUGALPublisher:HOLT MCDOUGAL
 Functions and Change: A Modeling Approach to Coll...AlgebraISBN:9781337111348Author:Bruce Crauder, Benny Evans, Alan NoellPublisher:Cengage Learning
 Linear Algebra: A Modern IntroductionAlgebraISBN:9781285463247Author:David PoolePublisher:Cengage Learning
 College Algebra (MindTap Course List)AlgebraISBN:9781305652231Author:R. David Gustafson, Jeff HughesPublisher:Cengage Learning
Glencoe Algebra 1, Student Edition, 9780079039897...
Algebra
ISBN:9780079039897
Author:Carter
Publisher:McGraw Hill
Big Ideas Math A Bridge To Success Algebra 1: Stu...
Algebra
ISBN:9781680331141
Author:HOUGHTON MIFFLIN HARCOURT
Publisher:Houghton Mifflin Harcourt
Holt Mcdougal Larson Pre-algebra: Student Edition...
Algebra
ISBN:9780547587776
Author:HOLT MCDOUGAL
Publisher:HOLT MCDOUGAL
Functions and Change: A Modeling Approach to Coll...
Algebra
ISBN:9781337111348
Author:Bruce Crauder, Benny Evans, Alan Noell
Publisher:Cengage Learning
Linear Algebra: A Modern Introduction
Algebra
ISBN:9781285463247
Author:David Poole
Publisher:Cengage Learning
College Algebra (MindTap Course List)
Algebra
ISBN:9781305652231
Author:R. David Gustafson, Jeff Hughes
Publisher:Cengage Learning
Correlation Vs Regression: Difference Between them with definition & Comparison Chart; Author: Key Differences;https://www.youtube.com/watch?v=Ou2QGSJVd0U;License: Standard YouTube License, CC-BY
Correlation and Regression: Concepts with Illustrative examples; Author: LEARN & APPLY : Lean and Six Sigma;https://www.youtube.com/watch?v=xTpHD5WLuoA;License: Standard YouTube License, CC-BY