
Statistics: The Art and Science of Learning from Data (4th Edition)
4th Edition
ISBN: 9780321997838
Author: Alan Agresti, Christine A. Franklin, Bernhard Klingenberg
Publisher: PEARSON
expand_more
expand_more
format_list_bulleted
Concept explainers
Videos
Textbook Question
Chapter 3.2, Problem 16PB
Match the
- 1. r = –0.9
- 2. r = –0.5
- 3. r = 0
- 4. r = 0.6
(a) 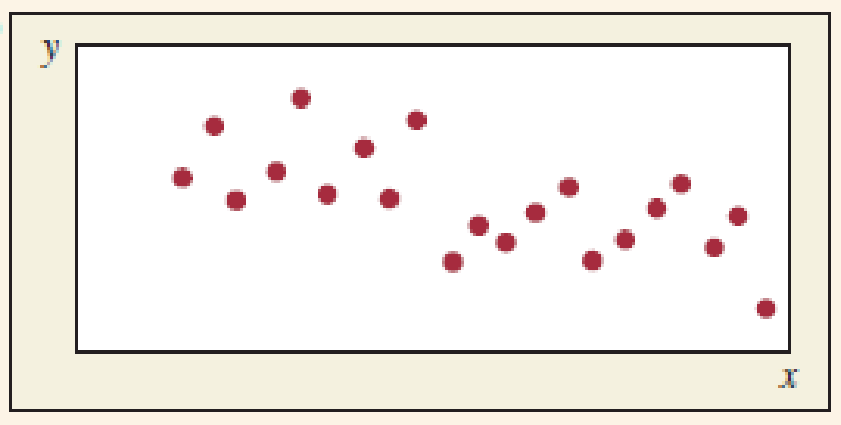
(b) 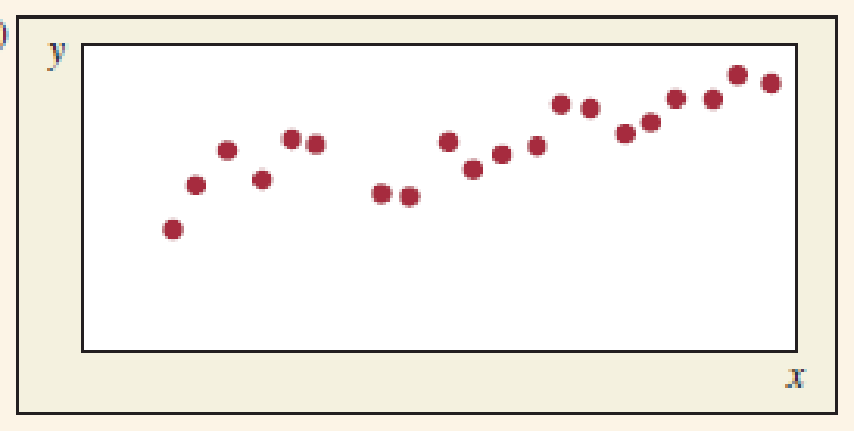
(c ) 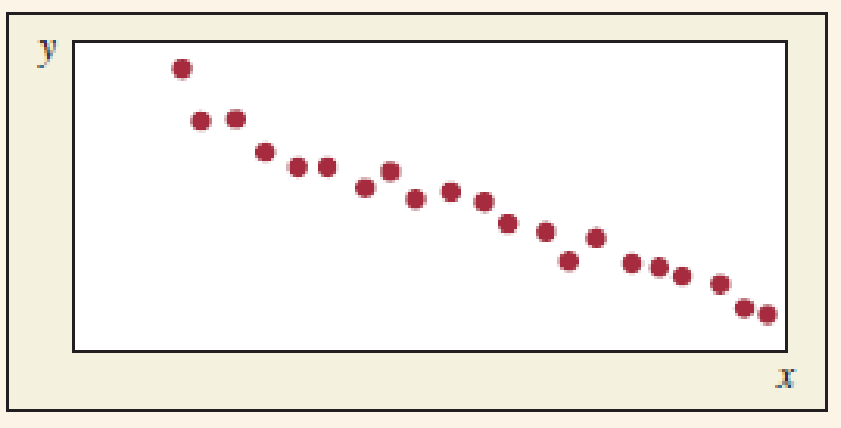
(d) 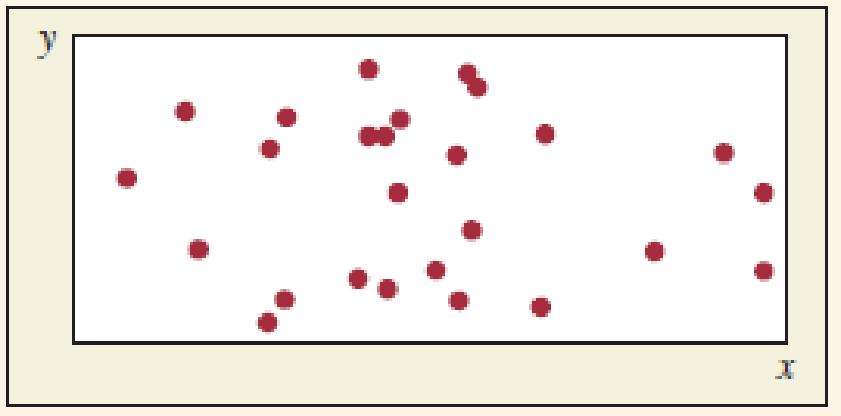
Expert Solution & Answer
Want to see the full answer?
Check out a sample textbook solution
Students have asked these similar questions
ons
12. A sociologist hypothesizes that the crime rate is higher in areas
with higher poverty rate and lower median income. She col-
lects data on the crime rate (crimes per 100,000 residents),
the poverty rate (in %), and the median income (in $1,000s)
from 41 New England cities. A portion of the regression results
is shown in the following table.
Standard
Coefficients
error
t stat
p-value
Intercept
-301.62
549.71
-0.55 0.5864
Poverty
53.16
14.22
3.74 0.0006
Income
4.95
8.26
0.60 0.5526
a.
b.
Are the signs as expected on the slope coefficients?
Predict the crime rate in an area with a poverty rate of
20% and a median income of $50,000.
3. Using data from 50 work
2. The owner of several used-car dealerships believes that the
selling price of a used car can best be predicted using the car's
age. He uses data on the recent selling price (in $) and age of
20 used sedans to estimate Price = Po + B₁Age + ε. A portion
of the regression results is shown in the accompanying table.
Standard
Coefficients
Intercept
21187.94
Error
733.42
t Stat p-value
28.89 1.56E-16
Age
-1208.25
128.95 -9.37
2.41E-08
a. What is the estimate for B₁? Interpret this value.
b. What is the sample regression equation?
C. Predict the selling price of a 5-year-old sedan.
ian income of $50,000.
erty rate of
13. Using data from 50 workers, a researcher estimates Wage =
Bo+B,Education + B₂Experience + B3Age+e, where Wage
is the hourly wage rate and Education, Experience, and Age
are the years of higher education, the years of experience, and
the age of the worker, respectively. A portion of the regression
results is shown in the following table. ni ogolloo bash
1
Standard
Coefficients error
t stat p-value
Intercept
7.87
4.09
1.93
0.0603
Education
1.44
0.34
4.24 0.0001
Experience
0.45
0.14
3.16
0.0028
Age
-0.01
0.08 -0.14 0.8920
a. Interpret the estimated coefficients for Education and
Experience.
b. Predict the hourly wage rate for a 30-year-old worker
with four years of higher education and three years of
experience.
Chapter 3 Solutions
Statistics: The Art and Science of Learning from Data (4th Edition)
Ch. 3.1 - Which is the response/explanatory variable? For...Ch. 3.1 - Sales and advertising Each month, the owner of...Ch. 3.1 - Does higher income make you happy? Every General...Ch. 3.1 - Diamonds The clarity and cut of a diamond are two...Ch. 3.1 - Alcohol and college students The Harvard School of...Ch. 3.1 - How to fight terrorism? A survey of 1000 adult...Ch. 3.1 - Heaven and hell Two questions on the General...Ch. 3.1 - Prob. 8PBCh. 3.1 - Gender gap in party ID In recent election years,...Ch. 3.1 - Use the GSS Go to the GSS website...
Ch. 3.2 - Used cars and direction of association For the 100...Ch. 3.2 - Broadband and GDP The Internet Use data file on...Ch. 3.2 - Prob. 13PBCh. 3.2 - Politics and newspaper reading For the FL Student...Ch. 3.2 - Prob. 15PBCh. 3.2 - Match the scatterplot with r Match the following...Ch. 3.2 - Prob. 17PBCh. 3.2 - Prob. 18PBCh. 3.2 - Prob. 19PBCh. 3.2 - Prob. 20PBCh. 3.2 - Prob. 21PBCh. 3.2 - Prob. 22PBCh. 3.2 - Prob. 23PBCh. 3.3 - Sketch plots of lines Identify the values of the...Ch. 3.3 - Prob. 25PBCh. 3.3 - Home selling prices The House Selling Prices FL...Ch. 3.3 - Prob. 27PBCh. 3.3 - Prob. 28PBCh. 3.3 - Prob. 29PBCh. 3.3 - Broadband subscribers and population The Internet...Ch. 3.3 - Prob. 31PBCh. 3.3 - Prob. 32PBCh. 3.3 - Regression between cereal sodium and sugar The...Ch. 3.3 - Prob. 34PBCh. 3.3 - Advertising and sales Each month, the owner of...Ch. 3.3 - Midtermfinal correlation For students who take...Ch. 3.3 - Predict final exam from midterm In an introductory...Ch. 3.3 - NL baseball Example 9 related y = team scoring...Ch. 3.3 - Study time and college GPA A graduate teaching...Ch. 3.3 - Oil and GDP An article in the September 16, 2006,...Ch. 3.3 - Mountain bikes revisited Is there a relationship...Ch. 3.3 - Mountain bike and suspension type Refer to the...Ch. 3.3 - Fuel Consumption Most cars are fuel efficient when...Ch. 3.4 - Extrapolating murder The SPSS figure shows the...Ch. 3.4 - Mens Olympic long jumps The Olympic winning mens...Ch. 3.4 - U.S. average annual temperatures Use the U.S....Ch. 3.4 - Murder and education Example 13 found the...Ch. 3.4 - Murder and poverty For Table 3.6, the regression...Ch. 3.4 - TV watching and the birth rate The figure shows...Ch. 3.4 - Looking for outliers Using software, analyze the...Ch. 3.4 - Regression between cereal sodium and sugar Let x =...Ch. 3.4 - Gestational period and life expectancy Does the...Ch. 3.4 - Antidrug campaigns An Associated Press story (June...Ch. 3.4 - Whats wrong with regression? Explain whats wrong...Ch. 3.4 - Education causes crime? The table shows a small...Ch. 3.4 - Death penalty and race The table shows results of...Ch. 3.4 - NAEP scores Eighth-grade math scores on the...Ch. 3.4 - Age a confounder? A study observes that the...Ch. 3 - Choose explanatory and response For the following...Ch. 3 - Graphing data For each case in the previous...Ch. 3 - Life after death for males and females In a recent...Ch. 3 - God and happiness Go to the GSS website...Ch. 3 - Degrees and income The mean annual salaries earned...Ch. 3 - Bacteria in ground turkey Consumer Reports...Ch. 3 - Women managers in the work force The following...Ch. 3 - RateMyProfessor.com The website RateMyProfessors....Ch. 3 - Women in government and economic life The OECD...Ch. 3 - African droughts and dust Is there a relationship...Ch. 3 - Crime rate and urbanization For the data in...Ch. 3 - Gestational period and life expectancy revisited...Ch. 3 - Height and paycheck The headline of an article in...Ch. 3 - Predicting college GPA An admissions officer...Ch. 3 - College GPA = high school GPA Refer to the...Ch. 3 - Whats a college degree worth? In 2002, a census...Ch. 3 - Care Weight and gas hogs: The table shows a short...Ch. 3 - Predicting Internet use from cell phone use We now...Ch. 3 - Income depends on education? For a study of...Ch. 3 - Fertility and GDP Refer to the Human Development...Ch. 3 - Women working and birth rate Using data from...Ch. 3 - Education and income The regression equation for a...Ch. 3 - Income in euros Refer to the previous exercise....Ch. 3 - Changing units for cereal data Refer to the Cereal...Ch. 3 - Murder and single-parent families For Table 3.6 on...Ch. 3 - Violent crime and college education For the U.S....Ch. 3 - Violent crime and high school education Repeat the...Ch. 3 - Crime and urbanization For the U.S. Statewide...Ch. 3 - High school graduation rates and health insurance...Ch. 3 - Womens Olympic high jumps Example 11 discussed how...Ch. 3 - Income and height A survey of adults revealed a...Ch. 3 - More TV watching goes with fewer babies? For...Ch. 3 - More sleep causes death? An Associated Press story...Ch. 3 - Ask Marilyn Marilyn vos Savant writes a column for...Ch. 3 - Time studying and GPA Is there a relationship...Ch. 3 - Warming in Newnan, Georgia Access the Newnan GA...Ch. 3 - Fluoride and AIDS An Associated Press story...Ch. 3 - Fish fights Alzheimers An AP story (July 22, 2003)...Ch. 3 - Dogs make you healthier A study published in the...Ch. 3 - Multiple choice: Correlate GPA and GRE In a study...Ch. 3 - Multiple choice: Properties of r Which of the...Ch. 3 - Multiple choice: Interpreting r One can interpret...Ch. 3 - Multiple choice: Correct statement about r Which...Ch. 3 - Multiple choice: Describing association between...Ch. 3 - Multiple choice: Slope and correlation The slope...Ch. 3 - Multiple choice: Interpretation of r2 An r2...Ch. 3 - True or false The variables y = annual income...Ch. 3 - Correlation doesnt depend on units Suppose you...Ch. 3 - When correlation = slope Consider the formula...Ch. 3 - Center of the data Consider the formula a=ybx for...Ch. 3 - Final exam regresses toward mean of midterm Let y...Ch. 3 - Activity: Guess the correlation The Guess the...
Knowledge Booster


Learn more about
Need a deep-dive on the concept behind this application? Look no further. Learn more about this topic, statistics and related others by exploring similar questions and additional content below.Similar questions
- 1. If a firm spends more on advertising, is it likely to increase sales? Data on annual sales (in $100,000s) and advertising expenditures (in $10,000s) were collected for 20 firms in order to estimate the model Sales = Po + B₁Advertising + ε. A portion of the regression results is shown in the accompanying table. Intercept Advertising Standard Coefficients Error t Stat p-value -7.42 1.46 -5.09 7.66E-05 0.42 0.05 8.70 7.26E-08 a. Interpret the estimated slope coefficient. b. What is the sample regression equation? C. Predict the sales for a firm that spends $500,000 annually on advertising.arrow_forwardCan you help me solve problem 38 with steps im stuck.arrow_forwardHow do the samples hold up to the efficiency test? What percentages of the samples pass or fail the test? What would be the likelihood of having the following specific number of efficiency test failures in the next 300 processors tested? 1 failures, 5 failures, 10 failures and 20 failures.arrow_forward
- The battery temperatures are a major concern for us. Can you analyze and describe the sample data? What are the average and median temperatures? How much variability is there in the temperatures? Is there anything that stands out? Our engineers’ assumption is that the temperature data is normally distributed. If that is the case, what would be the likelihood that the Safety Zone temperature will exceed 5.15 degrees? What is the probability that the Safety Zone temperature will be less than 4.65 degrees? What is the actual percentage of samples that exceed 5.25 degrees or are less than 4.75 degrees? Is the manufacturing process producing units with stable Safety Zone temperatures? Can you check if there are any apparent changes in the temperature pattern? Are there any outliers? A closer look at the Z-scores should help you in this regard.arrow_forwardNeed help pleasearrow_forwardPlease conduct a step by step of these statistical tests on separate sheets of Microsoft Excel. If the calculations in Microsoft Excel are incorrect, the null and alternative hypotheses, as well as the conclusions drawn from them, will be meaningless and will not receive any points. 4. One-Way ANOVA: Analyze the customer satisfaction scores across four different product categories to determine if there is a significant difference in means. (Hints: The null can be about maintaining status-quo or no difference among groups) H0 = H1=arrow_forward
- Please conduct a step by step of these statistical tests on separate sheets of Microsoft Excel. If the calculations in Microsoft Excel are incorrect, the null and alternative hypotheses, as well as the conclusions drawn from them, will be meaningless and will not receive any points 2. Two-Sample T-Test: Compare the average sales revenue of two different regions to determine if there is a significant difference. (Hints: The null can be about maintaining status-quo or no difference among groups; if alternative hypothesis is non-directional use the two-tailed p-value from excel file to make a decision about rejecting or not rejecting null) H0 = H1=arrow_forwardPlease conduct a step by step of these statistical tests on separate sheets of Microsoft Excel. If the calculations in Microsoft Excel are incorrect, the null and alternative hypotheses, as well as the conclusions drawn from them, will be meaningless and will not receive any points 3. Paired T-Test: A company implemented a training program to improve employee performance. To evaluate the effectiveness of the program, the company recorded the test scores of 25 employees before and after the training. Determine if the training program is effective in terms of scores of participants before and after the training. (Hints: The null can be about maintaining status-quo or no difference among groups; if alternative hypothesis is non-directional, use the two-tailed p-value from excel file to make a decision about rejecting or not rejecting the null) H0 = H1= Conclusion:arrow_forwardPlease conduct a step by step of these statistical tests on separate sheets of Microsoft Excel. If the calculations in Microsoft Excel are incorrect, the null and alternative hypotheses, as well as the conclusions drawn from them, will be meaningless and will not receive any points. The data for the following questions is provided in Microsoft Excel file on 4 separate sheets. Please conduct these statistical tests on separate sheets of Microsoft Excel. If the calculations in Microsoft Excel are incorrect, the null and alternative hypotheses, as well as the conclusions drawn from them, will be meaningless and will not receive any points. 1. One Sample T-Test: Determine whether the average satisfaction rating of customers for a product is significantly different from a hypothetical mean of 75. (Hints: The null can be about maintaining status-quo or no difference; If your alternative hypothesis is non-directional (e.g., μ≠75), you should use the two-tailed p-value from excel file to…arrow_forward
- Please conduct a step by step of these statistical tests on separate sheets of Microsoft Excel. If the calculations in Microsoft Excel are incorrect, the null and alternative hypotheses, as well as the conclusions drawn from them, will be meaningless and will not receive any points. 1. One Sample T-Test: Determine whether the average satisfaction rating of customers for a product is significantly different from a hypothetical mean of 75. (Hints: The null can be about maintaining status-quo or no difference; If your alternative hypothesis is non-directional (e.g., μ≠75), you should use the two-tailed p-value from excel file to make a decision about rejecting or not rejecting null. If alternative is directional (e.g., μ < 75), you should use the lower-tailed p-value. For alternative hypothesis μ > 75, you should use the upper-tailed p-value.) H0 = H1= Conclusion: The p value from one sample t-test is _______. Since the two-tailed p-value is _______ 2. Two-Sample T-Test:…arrow_forwardPlease conduct a step by step of these statistical tests on separate sheets of Microsoft Excel. If the calculations in Microsoft Excel are incorrect, the null and alternative hypotheses, as well as the conclusions drawn from them, will be meaningless and will not receive any points. What is one sample T-test? Give an example of business application of this test? What is Two-Sample T-Test. Give an example of business application of this test? .What is paired T-test. Give an example of business application of this test? What is one way ANOVA test. Give an example of business application of this test? 1. One Sample T-Test: Determine whether the average satisfaction rating of customers for a product is significantly different from a hypothetical mean of 75. (Hints: The null can be about maintaining status-quo or no difference; If your alternative hypothesis is non-directional (e.g., μ≠75), you should use the two-tailed p-value from excel file to make a decision about rejecting or not…arrow_forwardThe data for the following questions is provided in Microsoft Excel file on 4 separate sheets. Please conduct a step by step of these statistical tests on separate sheets of Microsoft Excel. If the calculations in Microsoft Excel are incorrect, the null and alternative hypotheses, as well as the conclusions drawn from them, will be meaningless and will not receive any points. What is one sample T-test? Give an example of business application of this test? What is Two-Sample T-Test. Give an example of business application of this test? .What is paired T-test. Give an example of business application of this test? What is one way ANOVA test. Give an example of business application of this test? 1. One Sample T-Test: Determine whether the average satisfaction rating of customers for a product is significantly different from a hypothetical mean of 75. (Hints: The null can be about maintaining status-quo or no difference; If your alternative hypothesis is non-directional (e.g., μ≠75), you…arrow_forward
arrow_back_ios
SEE MORE QUESTIONS
arrow_forward_ios
Recommended textbooks for you
 Glencoe Algebra 1, Student Edition, 9780079039897...AlgebraISBN:9780079039897Author:CarterPublisher:McGraw Hill
 Big Ideas Math A Bridge To Success Algebra 1: Stu...AlgebraISBN:9781680331141Author:HOUGHTON MIFFLIN HARCOURTPublisher:Houghton Mifflin Harcourt
 Algebra and Trigonometry (MindTap Course List)AlgebraISBN:9781305071742Author:James Stewart, Lothar Redlin, Saleem WatsonPublisher:Cengage Learning
 Holt Mcdougal Larson Pre-algebra: Student Edition...AlgebraISBN:9780547587776Author:HOLT MCDOUGALPublisher:HOLT MCDOUGAL
 Functions and Change: A Modeling Approach to Coll...AlgebraISBN:9781337111348Author:Bruce Crauder, Benny Evans, Alan NoellPublisher:Cengage Learning
Glencoe Algebra 1, Student Edition, 9780079039897...
Algebra
ISBN:9780079039897
Author:Carter
Publisher:McGraw Hill
Big Ideas Math A Bridge To Success Algebra 1: Stu...
Algebra
ISBN:9781680331141
Author:HOUGHTON MIFFLIN HARCOURT
Publisher:Houghton Mifflin Harcourt
Algebra and Trigonometry (MindTap Course List)
Algebra
ISBN:9781305071742
Author:James Stewart, Lothar Redlin, Saleem Watson
Publisher:Cengage Learning
Holt Mcdougal Larson Pre-algebra: Student Edition...
Algebra
ISBN:9780547587776
Author:HOLT MCDOUGAL
Publisher:HOLT MCDOUGAL
Functions and Change: A Modeling Approach to Coll...
Algebra
ISBN:9781337111348
Author:Bruce Crauder, Benny Evans, Alan Noell
Publisher:Cengage Learning
The Shape of Data: Distributions: Crash Course Statistics #7; Author: CrashCourse;https://www.youtube.com/watch?v=bPFNxD3Yg6U;License: Standard YouTube License, CC-BY
Shape, Center, and Spread - Module 20.2 (Part 1); Author: Mrmathblog;https://www.youtube.com/watch?v=COaid7O_Gag;License: Standard YouTube License, CC-BY
Shape, Center and Spread; Author: Emily Murdock;https://www.youtube.com/watch?v=_YyW0DSCzpM;License: Standard Youtube License