
Modern Business Statistics with Microsoft Office Excel (with XLSTAT Education Edition Printed Access Card) (MindTap Course List)
6th Edition
ISBN: 9781337115186
Author: David R. Anderson, Dennis J. Sweeney, Thomas A. Williams, Jeffrey D. Camm, James J. Cochran
Publisher: Cengage Learning
expand_more
expand_more
format_list_bulleted
Concept explainers
Videos
Textbook Question
Chapter 3, Problem 71SE
NFL Teams Worth. In 2014, the 32 teams in the National Football League (NFL) were worth, on average, $1.17 billion, 5% more than in 2013. The following data show the annual revenue ($ millions) and the estimated team value ($ millions) for the 32 NFL teams in 2014 (Forbes website).
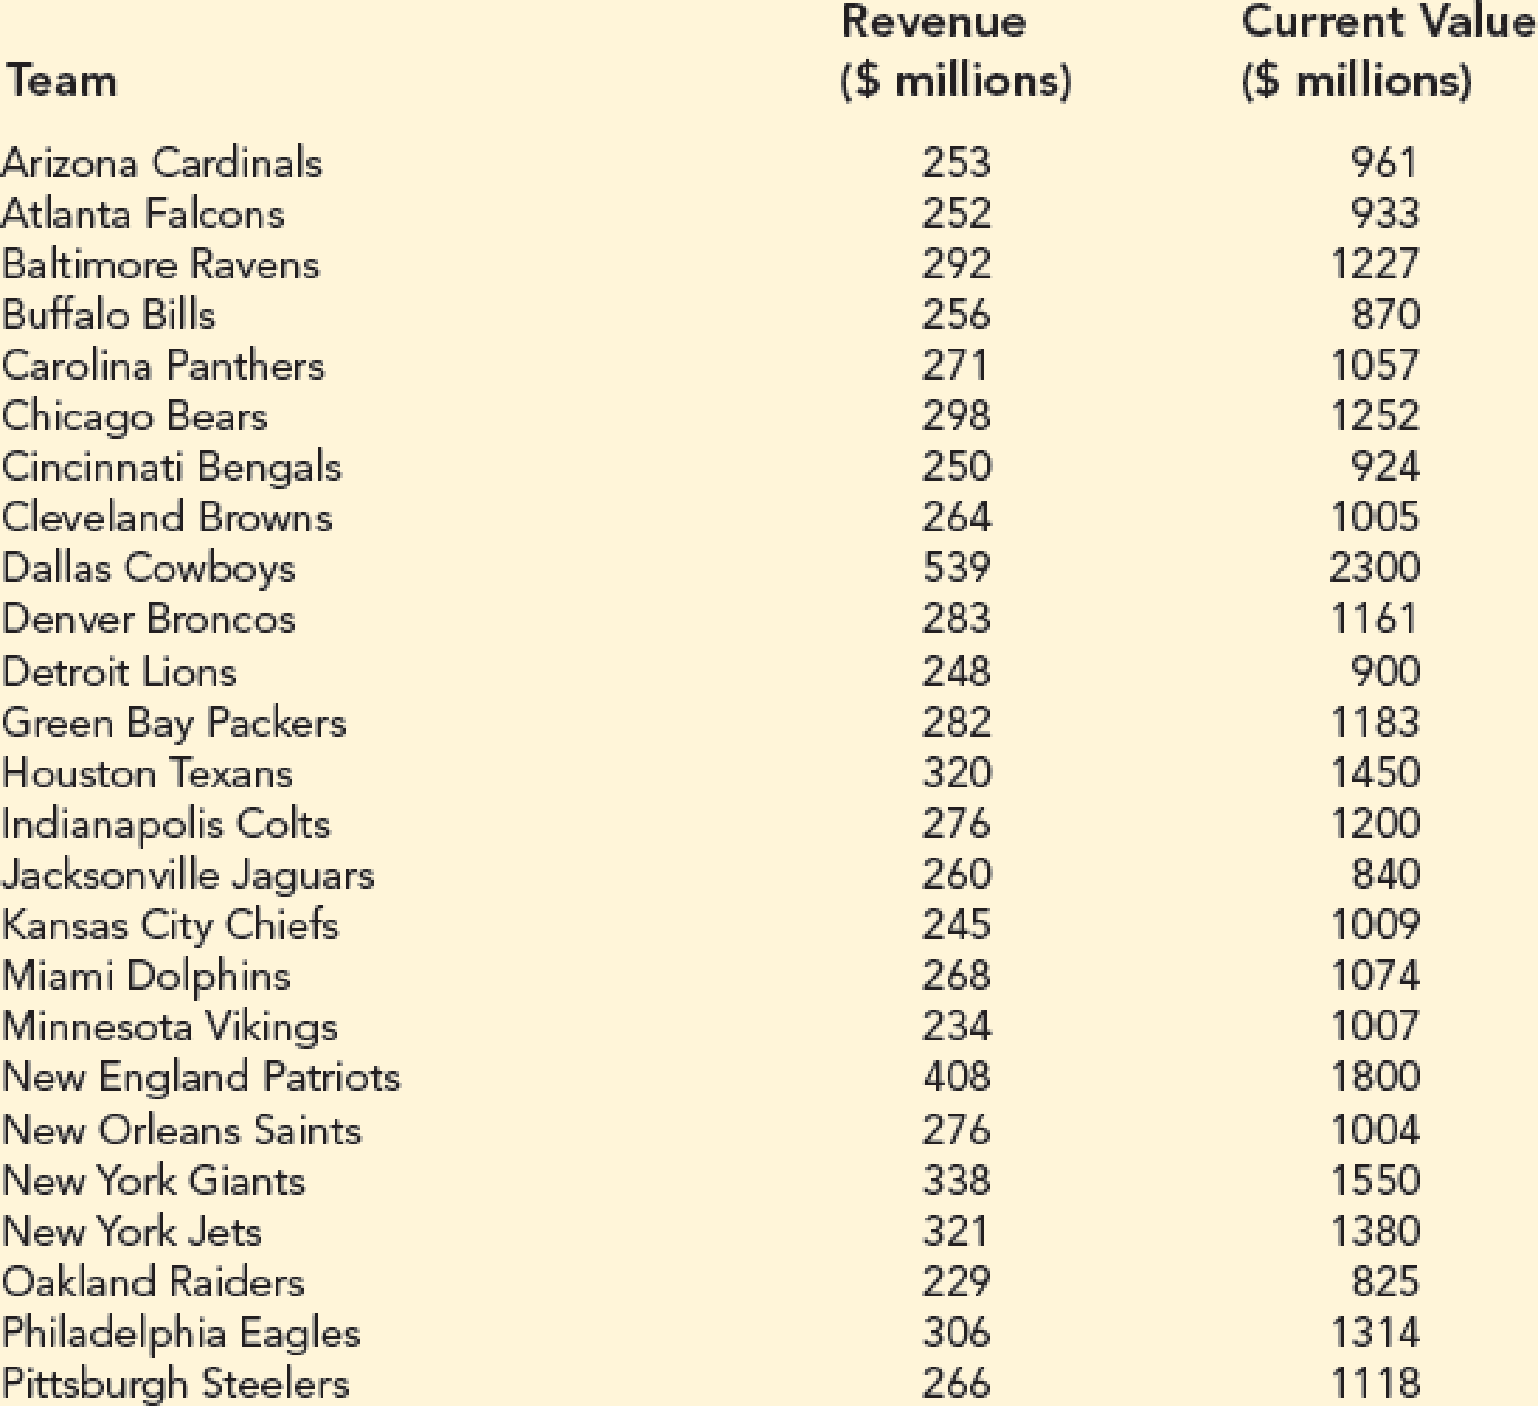
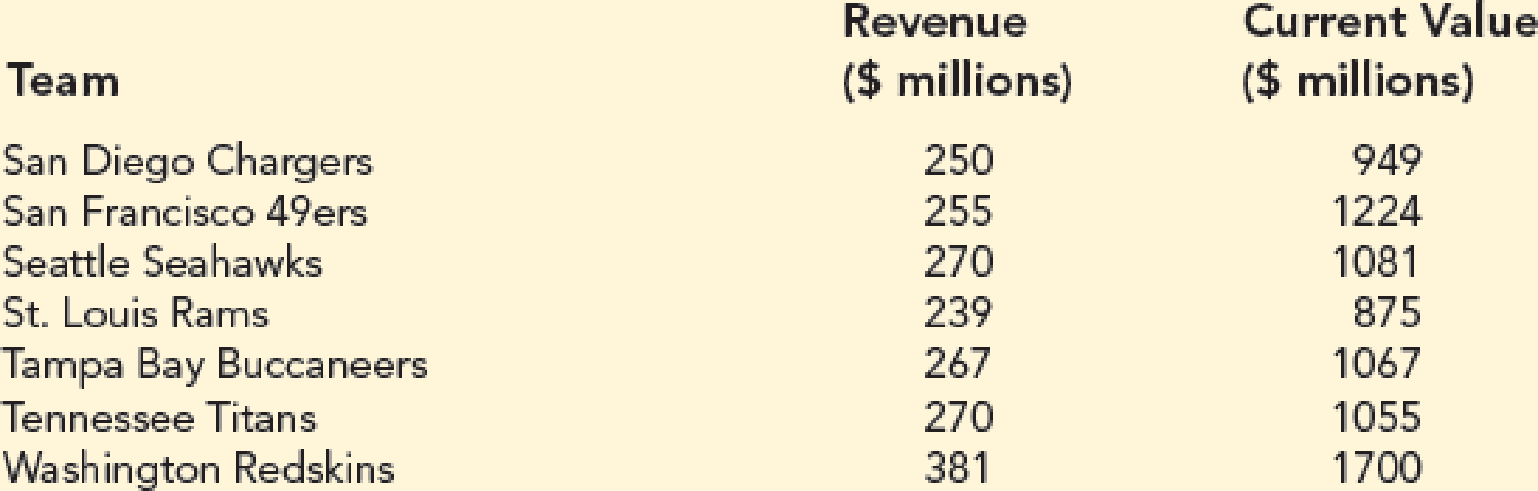
- a. Develop a
scatter diagram with Revenue on the horizontal axis and Value on the vertical axis. Does there appear that there is any relationship between the two variables? - b. What is the sample
correlation coefficient ? What can you say about the strength of the relationship between Revenue and Value?
Expert Solution & Answer
Want to see the full answer?
Check out a sample textbook solution
Students have asked these similar questions
Southwest Airlines had 81.1 million domestic boardings in a recent year, followed by Delta Airlines with 79.4 million, American Airlines with 72.6 million, United Airlines with 56.3 million, Northwest Airlines with 43.3 million, US Airways with 37.8 million, and Continental Airlines with 31.5 million, according to T-100 Domestic Market.
Construct a pie chart to depict this information.
List down the variable of the above data.
Describe whether each variable are qualitative or quantitative data? Explain your answer.
Describe the level of measurement for the variables. Explain your answer.
16
20
40
60
80
100
Miles (1000s)
120
Scatter diagram 1
b. What does the scatter diagram developed in part (a) indicate about the relationship between the two variables?
Negative relationship
c. Develop the estimated regression equation that could be used to predict the price ($1000s) (to 4 decimals).
16.469
.0588
I
d. Test for a significant relationship at the 0.05 level of significance (to 3 decimals).
p-value=
less than
α = 0.05.
e. Did the estimated regression equation provide a good fit?
Yes
f. Provide terpretation for the slope of the estimated regression equation (to 4 decimals but dollar value to the nearest cent). Enter negative values as negative numbers.
The slope of the estimated regression is -.0588. Therefore, every additional 1,000 miles on the car's odometr will result in a $
predicted price.
decrease
in the
g. Suppose that you are considering purchasing a previously owned 2007 Camry that has been driven 60,000 miles. Using the estimated regression equation developed in…
The number of yearly visits to physicians' offices varies in part by the age of the patient. For the data shown in the table, a
represents the age of patients (in yr) and n(a) represents the corresponding number of visits to physicians' offices per year.
(Source: Centers for Disease Control, www.cdc.gov)
35
20
55
65
85
6.7
п(a)
2.7
2.0
2.5
3.7
7.6
a. Use regression to find a quadratic function to model the data.
b. At what age is the number of yearly visits to physicians' offices the least? Round to the nearest year of age.
c. What is the minimum number of yearly visits? Round to 1 decimal place.
Chapter 3 Solutions
Modern Business Statistics with Microsoft Office Excel (with XLSTAT Education Edition Printed Access Card) (MindTap Course List)
Ch. 3.1 - 1. Consider a sample with data values of 10, 20,...Ch. 3.1 - 2. Consider a sample with data values of 10, 20,...Ch. 3.1 - 3. Consider the following data and corresponding...Ch. 3.1 - Prob. 4ECh. 3.1 - Prob. 5ECh. 3.1 - Prob. 6ECh. 3.1 - 7. The average number of minutes Americans commute...Ch. 3.1 - Middle-Level Manager Salaries. Suppose that an...Ch. 3.1 - 9. Which companies spend the most money on...Ch. 3.1 - Advertising Spending. Which companies spend the...
Ch. 3.1 - Prob. 11ECh. 3.1 -
The Big Bang Theory, a situation comedy...Ch. 3.1 - Automobile Fuel Efficiencies. In automobile...Ch. 3.1 -
The data contained in the DATAfile named...Ch. 3.1 - 15. Martinez Auto Supplies has retail stores...Ch. 3.1 - 16. The grade point average for college students...Ch. 3.1 - 17. The following table shows the total return and...Ch. 3.1 - 18. Based on a survey of master’s programs in...Ch. 3.1 - Annual revenue for Corning Supplies grew by 5.5%...Ch. 3.1 - Suppose that at the beginning of Year 1 you...Ch. 3.1 - Prob. 21ECh. 3.1 - Prob. 22ECh. 3.2 - 23. Consider a sample with data values of 10, 20,...Ch. 3.2 - Prob. 24ECh. 3.2 - Consider a sample with data values of 27, 25, 20,...Ch. 3.2 - Price of Unleaded Gasoline. Data collected by the...Ch. 3.2 - Round-Trip Flight Prices. The following table...Ch. 3.2 -
The Australian Open is the first of the four...Ch. 3.2 - Air Quality Index. The Los Angeles Times regularly...Ch. 3.2 - Prob. 30ECh. 3.2 -
The results of Accounting Principals’ latest...Ch. 3.2 - Advertising Spend by Companies. Advertising Age...Ch. 3.2 - Scores turned in by an amateur golfer at the...Ch. 3.2 - Consistency of Running Times. The following times...Ch. 3.3 - 35. Consider a sample with data values of 10, 20,...Ch. 3.3 - 36. Consider a sample with a mean of 500 and a...Ch. 3.3 - 37. Consider a sample with a mean of 30 and a...Ch. 3.3 - 38. Suppose the data have a bell-shaped...Ch. 3.3 - 39. The results of a national survey showed that...Ch. 3.3 - 40. The energy information Administration reported...Ch. 3.3 - 41. The Graduate Management Admission Test (GMAT)...Ch. 3.3 - 42. Many families in California are using backyard...Ch. 3.3 -
According to a Los Angeles Times study of more...Ch. 3.3 - NCAA Basketball Game Scores. A sample of 10 NCAA...Ch. 3.3 -
The Wall Street Journal reported that Walmart...Ch. 3.4 - Consider a sample with data values of 27, 25, 20,...Ch. 3.4 - Prob. 47ECh. 3.4 - Prob. 48ECh. 3.4 - Prob. 49ECh. 3.4 - Naples Half-Marathon Times. Naples, Florida, hosts...Ch. 3.4 - Pharmaceutical Company Sales. Annual sales, in...Ch. 3.4 - Cell Phone Companies Customer Satisfaction....Ch. 3.4 - Most Admired Companies. Fortune magazine’s list of...Ch. 3.4 - Prob. 54ECh. 3.5 - Five observations taken for two variables...Ch. 3.5 - Prob. 56ECh. 3.5 - The DATAfile TwoStocks contains adjusted monthly...Ch. 3.5 - Driving Speed and Fuel Efficiency. A department of...Ch. 3.5 - Smoke Detector Use and Death Rates. Over the past...Ch. 3.5 - Stock Market Indexes Comparison. The Russell 1000...Ch. 3.5 - Best Private Colleges. A random sample of 30...Ch. 3 - Americans Dining Out. Americans tend to dine out...Ch. 3 - NCAA Football Coaches Salaries. A 2017 USA Today...Ch. 3 - Physician Office Waiting Times. The average...Ch. 3 - Worker Productivity and Insomnia. U.S. companies...Ch. 3 -
A study of smartphone users shows that 68% of...Ch. 3 - Work Commuting Methods. Public transportation and...Ch. 3 - Household Incomes. The following data represent a...Ch. 3 - Restaurant Chains’ Sales per Store. The data...Ch. 3 - Prob. 70SECh. 3 - NFL Teams Worth. In 2014, the 32 teams in the...Ch. 3 - MLB Team Winning Percentages. Does a major league...Ch. 3 - 73. The days to maturity for a sample of five...Ch. 3 - 74. Automobiles traveling on a road with a posted...Ch. 3 - Annual Returns for Panama Railroad Company Stock....Ch. 3 - Pelican Stores, a division of National Clothing,...Ch. 3 -
The motion picture industry is a competitive...Ch. 3 - The pursuit of a higher education degree in...Ch. 3 - Although millions of elephants once roamed across...
Knowledge Booster


Learn more about
Need a deep-dive on the concept behind this application? Look no further. Learn more about this topic, statistics and related others by exploring similar questions and additional content below.Similar questions
- badly needed right now, pleasearrow_forwardPlease help with (d)arrow_forward- х i Data Table ets he Full data set O Assets R&D Expense R&D Expense 712.087 Assets 3,478.557 3,462.224 1,206.455 345.709 7,785.525 389.959 918.899 90.404 117.895 2,390.016 257.571 446.339 47.523 678.531 71.401 1,069.117 2,465.859 3,945.287 168.631 111.724 2,648.273 3,406.446 9,250.323 292.876 224.715 383.186 nt 410.051 988.349 19.257 485.204 55.161 493.116 55.046 2,363.477 251.699 0) 102.148 13.489 221.321 27.958 3,728.419 1,389.377 1,706.486 327.691 1,465.861 158.293 141.616 165.093 19.154 161.317 2,988.141 301.803 nat Print Donearrow_forward
- B and carrow_forwardA corporation that operates five suppliers of athletic apparel in a region provides merchandise for a shoe company. The shoe company recently sought information from the five plants. One variable for which data were collected was the total money (in dollars) the company spent on medical support for its employees in the first three months of the year. Data on number of employees at the plants are also shown below. Complete parts a and b. Medical Employees $7,788 121 $14,371 409 $12,776 256 $6,874 107 $3,907 O 68 a. Compute the weighted mean medical payments for these five plants using the numbers of employees as the weights. The weighted mean is $. (Round to the nearest dollar as needed.)arrow_forwardThe table shows median annual earnings for women and men with various levels of education. As a percentage, how much more does a man with a bachelor's degree earn than a woman with a bachelor's degree? Assuming the difference remains constant over a 40-year career, how much more does the man earn than the woman? Women Men High School Only $21,218 $40,220 Associate's Bachelor's degree Only degree Only $39,790 $50,299 $49,249 $66,714 Professional Degree $80,440 $119,628 A man with a bachelor's degree eams % more annually than a woman with a bachelor's degree. (Round to the nearest whole number as needed.) Over a 40-year career, a man with a bachelor's degree earns $ (Round to the nearest whole number as needed.) more than a woman with a bachelor's degree.arrow_forward
- A real estate agent wanted to find the relationship between sale price of houses and the size of the house. She collected data on two variables recorded in the following table for 15 houses in Seattle. The two variables are PRICE= Sale price of houses in thousands of dollars SIZE= Area of the entire house in square feet. PRICE 455 278 463 327 505 264 445 346 487 289 434 411 223 323 488 250 225 290 180 320 240 270 205 285 240 260 230 170 230 298 SIZE a) Using MICROSOFT EXCEL- run the above regression and copy the output into your assignment word document from which you can write down the least square regression line. Write down the least square regression line from that specific output. USE THE NAME OF VARIABLES WHEN YOU WRITE THE EQUATION. b) Interpret the slope and constant term with proper UNITS assigned. c) Comment on the explanatory power of the regression model from the required output. Copy that specific output into your assignment word document. Now to increase the explanatory…arrow_forwardThe data represent the cost, return on investment, and graduation rate for a random sample of fifty colleges or universities in the United States. The data is from payscale.com. The variable "Cost" represents the four-year cost including tuition, supplies, room and board of attending the school. The variable "Annual ROI" represents the return on investment for graduates of the school. It essentially represents how much you would earn on the investment of attending the school. The variable "Grad Rate" represents the graduation rate of the school. Complete parts (a) and (b) below. Click here to view the school data. Click here to view the table of critical values of the correlation coefficient. (a) Describe the association between Cost and Graduation Rate graphically by drawing a scatter diagram, treating Cost as the explanatory variable. Describe the association between Cost and Graduation Rate by finding the linear correlation between the two variables. Is there a linear association…arrow_forwardIf you could use a chart like this example to help me visualize everything thank you.arrow_forward
arrow_back_ios
SEE MORE QUESTIONS
arrow_forward_ios
Recommended textbooks for you
 Glencoe Algebra 1, Student Edition, 9780079039897...AlgebraISBN:9780079039897Author:CarterPublisher:McGraw Hill
 Holt Mcdougal Larson Pre-algebra: Student Edition...AlgebraISBN:9780547587776Author:HOLT MCDOUGALPublisher:HOLT MCDOUGAL
 Functions and Change: A Modeling Approach to Coll...AlgebraISBN:9781337111348Author:Bruce Crauder, Benny Evans, Alan NoellPublisher:Cengage Learning
 Algebra: Structure And Method, Book 1AlgebraISBN:9780395977224Author:Richard G. Brown, Mary P. Dolciani, Robert H. Sorgenfrey, William L. ColePublisher:McDougal Littell
Glencoe Algebra 1, Student Edition, 9780079039897...
Algebra
ISBN:9780079039897
Author:Carter
Publisher:McGraw Hill
Holt Mcdougal Larson Pre-algebra: Student Edition...
Algebra
ISBN:9780547587776
Author:HOLT MCDOUGAL
Publisher:HOLT MCDOUGAL
Functions and Change: A Modeling Approach to Coll...
Algebra
ISBN:9781337111348
Author:Bruce Crauder, Benny Evans, Alan Noell
Publisher:Cengage Learning
Algebra: Structure And Method, Book 1
Algebra
ISBN:9780395977224
Author:Richard G. Brown, Mary P. Dolciani, Robert H. Sorgenfrey, William L. Cole
Publisher:McDougal Littell
The Shape of Data: Distributions: Crash Course Statistics #7; Author: CrashCourse;https://www.youtube.com/watch?v=bPFNxD3Yg6U;License: Standard YouTube License, CC-BY
Shape, Center, and Spread - Module 20.2 (Part 1); Author: Mrmathblog;https://www.youtube.com/watch?v=COaid7O_Gag;License: Standard YouTube License, CC-BY
Shape, Center and Spread; Author: Emily Murdock;https://www.youtube.com/watch?v=_YyW0DSCzpM;License: Standard Youtube License