Modern Business Statistics with Microsoft Office Excel (with XLSTAT Education Edition Printed Access Card) (MindTap Course List)
6th Edition
ISBN: 9781337115186
Author: David R. Anderson, Dennis J. Sweeney, Thomas A. Williams, Jeffrey D. Camm, James J. Cochran
Publisher: Cengage Learning
bartleby

Videos

Textbook Question
Book Icon
Chapter 3, Problem 3CP

The pursuit of a higher education degree in business is now international. A survey shows that more and more Asians choose the master of business administration (MBA) degree route to corporate success. As a result, the number of applicants for MBA courses at Asia-Pacific schools continues to increase.

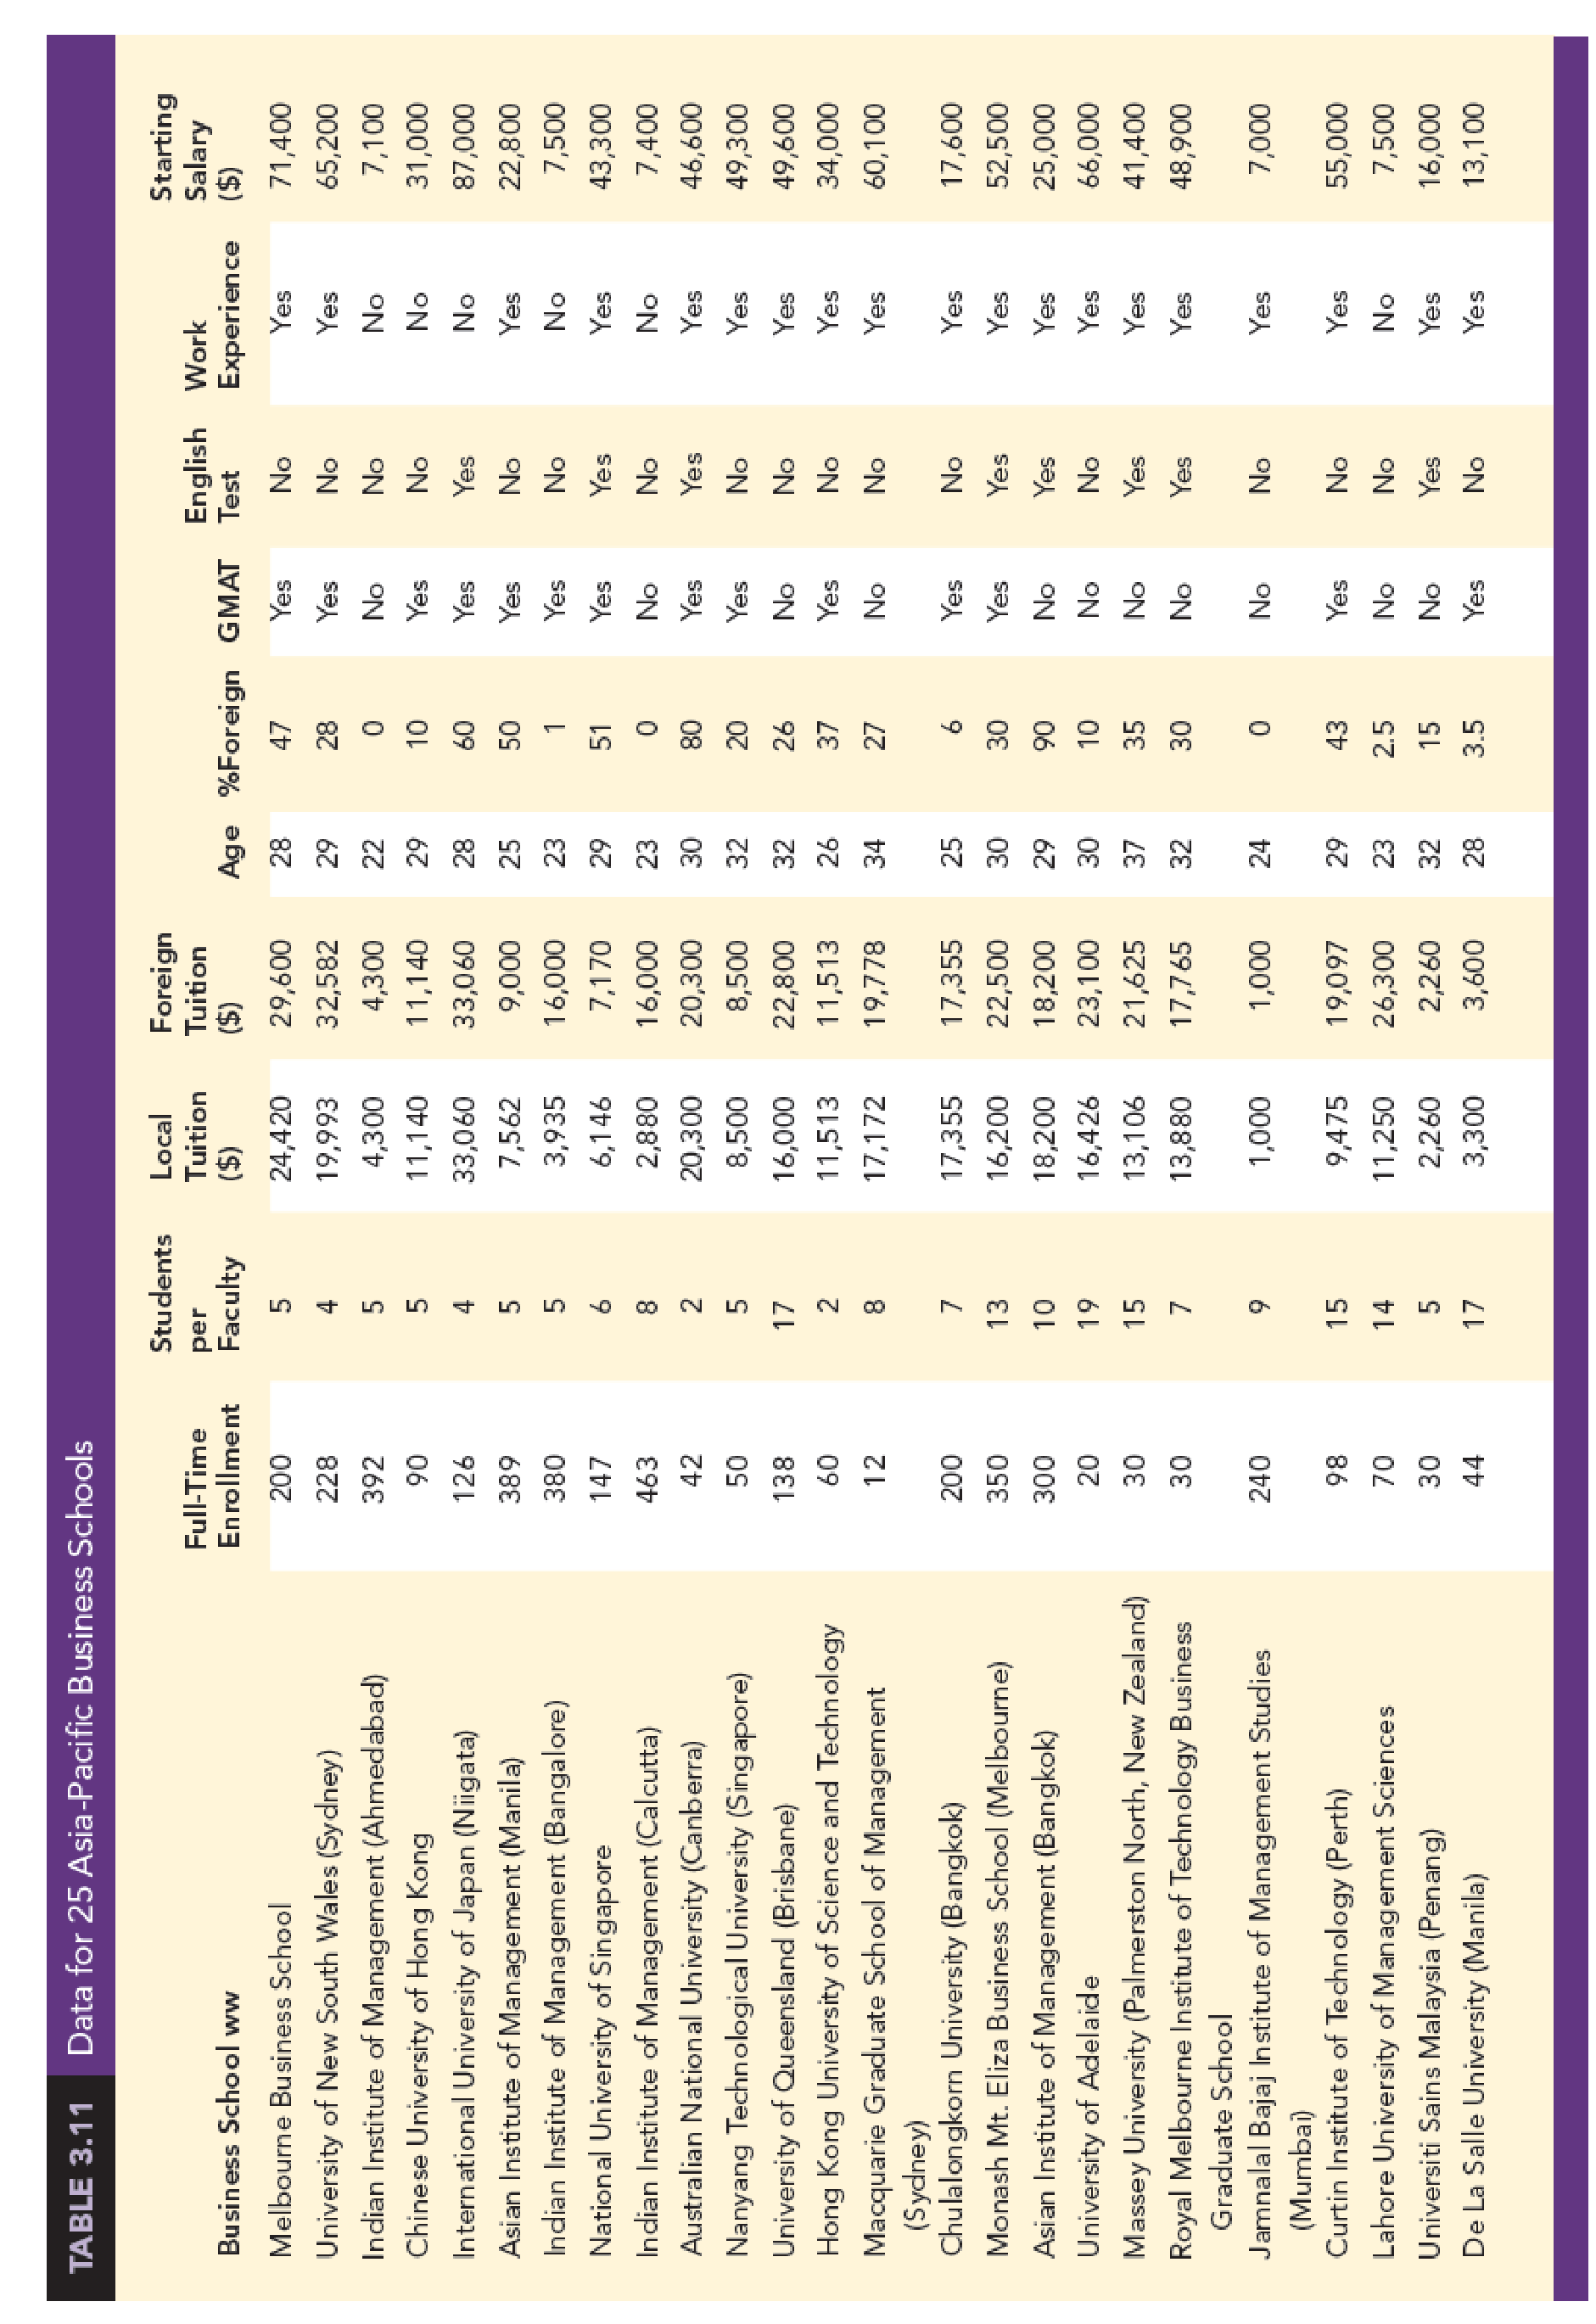
Across the region, thousands of Asians show an increasing willingness to temporarily shelve their careers and spend two years in pursuit of a theoretical business qualification. Courses in these schools are notoriously tough and include economics, banking, marketing, behavioral sciences, labor relations, decision making, strategic thinking, business law, and more. The data set in Table 3.11 shows some of the characteristics of the leading Asia-Pacific business schools.

Managerial Report

Use the methods of descriptive statistics to summarize the data in Table 3.11. Discuss your findings.

1. Include a summary for each variable in the data set. Make comments and interpretations based on maximums and minimums, as well as the appropriate means and proportions. What new insights do these descriptive statistics provide concerning Asia-Pacific business schools?

2. Summarize the data to compare the following:

  1. a. Any difference between local and foreign tuition costs.
  2. b. Any difference between mean starting salaries for schools requiring and not requiring work experience.
  3. c. Any difference between starting salaries for schools requiring and not requiring English tests.

3. Do starting salaries appear to be related to tuition?

4. Present any additional graphical and numerical summaries that will be beneficial in communicating the data in Table 3.11 to others.

Chapter 3, Problem 3CP, The pursuit of a higher education degree in business is now international. A survey shows that more

Blurred answer
Students have asked these similar questions
Burkina Faso, a landlocked country in West Africa, has the lowest adult literacy rate in the world (25.3%). Over the past 15 years, the government has focused heavily on improving access to education across the country. Between 2008 and 2015, the primary school completion rate rose from 40% to 60%, and the high school completion rate doubled over the same period from 15% to 30%. Despite these encouraging statistics, children in rural areas, especially girls, continue to have limited access to quality education. You put together a survey to collect information on the following variables and you are ready to analyze: Gender Age at last birthday Distance from school Level of education (Primary, Secondary, Post-Secondary)   Discuss what measure of central tendency is the most appropriate for each variable making sure to explain why.
Opinions are split about a coffee​ company's pumpkin-flavored coffee​ (PFC). Yet every year over the last five years the consumption of​ pumpkin-flavored goods has increased. If we look at the​ numbers, it also becomes clear why a leading coffee company keeps offering the PFC earlier and earlier every year. According to a​ magazine, the amount spent by PFC buyers at the coffee company is about​ 17% higher than​ non-PFC buyers. The accompanying table shows a random sample of eight​ consumers, the amount they spend per​ week, and the number of PFCs purchased per week.   PFC Spending     2 13.88     7 39.11     4 19.79     1 9.84     3 15.43     1 21.52     5 37.39     3 13.85 Calculate the slope and​ y-intercept for the regression formula.   The slope is b1=4.465​ The​ y-intercept is b0=6.840   Provide an interpretation for the value of the slope.   Because the slope is positive, it can be…
Opinions are split about a coffee​ company's pumpkin-flavored coffee​ (PFC). Yet every year over the last five years the consumption of​ pumpkin-flavored goods has increased. If we look at the​ numbers, it also becomes clear why a leading coffee company keeps offering the PFC earlier and earlier every year. According to a​ magazine, the amount spent by PFC buyers at the coffee company is about​ 17% higher than​ non-PFC buyers. The accompanying table shows a random sample of eight​ consumers, the amount they spend per​ week, y, and the number of PFCs​ purchased, x, per week. PFC Spending     1 13.17     8 38.65     3 19.49     2 9.56     4 15.85     1 21.82     5 37.53     3 13.69 α=​0.05 t= 3.07 p-value= 0.022   Construct a​ 95% confidence interval for the population slope.   UCL = 6.69 LCL = 0.75   What conclusions about PFC purchases and spending can be drawn from these​…

Chapter 3 Solutions

Modern Business Statistics with Microsoft Office Excel (with XLSTAT Education Edition Printed Access Card) (MindTap Course List)

Ch. 3.1 - Prob. 11ECh. 3.1 - The Big Bang Theory, a situation comedy...Ch. 3.1 - Automobile Fuel Efficiencies. In automobile...Ch. 3.1 - The data contained in the DATAfile named...Ch. 3.1 - 15. Martinez Auto Supplies has retail stores...Ch. 3.1 - 16. The grade point average for college students...Ch. 3.1 - 17. The following table shows the total return and...Ch. 3.1 - 18. Based on a survey of master’s programs in...Ch. 3.1 - Annual revenue for Corning Supplies grew by 5.5%...Ch. 3.1 - Suppose that at the beginning of Year 1 you...Ch. 3.1 - Prob. 21ECh. 3.1 - Prob. 22ECh. 3.2 - 23. Consider a sample with data values of 10, 20,...Ch. 3.2 - Prob. 24ECh. 3.2 - Consider a sample with data values of 27, 25, 20,...Ch. 3.2 - Price of Unleaded Gasoline. Data collected by the...Ch. 3.2 - Round-Trip Flight Prices. The following table...Ch. 3.2 - The Australian Open is the first of the four...Ch. 3.2 - Air Quality Index. The Los Angeles Times regularly...Ch. 3.2 - Prob. 30ECh. 3.2 - The results of Accounting Principals’ latest...Ch. 3.2 - Advertising Spend by Companies. Advertising Age...Ch. 3.2 - Scores turned in by an amateur golfer at the...Ch. 3.2 - Consistency of Running Times. The following times...Ch. 3.3 - 35. Consider a sample with data values of 10, 20,...Ch. 3.3 - 36. Consider a sample with a mean of 500 and a...Ch. 3.3 - 37. Consider a sample with a mean of 30 and a...Ch. 3.3 - 38. Suppose the data have a bell-shaped...Ch. 3.3 - 39. The results of a national survey showed that...Ch. 3.3 - 40. The energy information Administration reported...Ch. 3.3 - 41. The Graduate Management Admission Test (GMAT)...Ch. 3.3 - 42. Many families in California are using backyard...Ch. 3.3 - According to a Los Angeles Times study of more...Ch. 3.3 - NCAA Basketball Game Scores. A sample of 10 NCAA...Ch. 3.3 - The Wall Street Journal reported that Walmart...Ch. 3.4 - Consider a sample with data values of 27, 25, 20,...Ch. 3.4 - Prob. 47ECh. 3.4 - Prob. 48ECh. 3.4 - Prob. 49ECh. 3.4 - Naples Half-Marathon Times. Naples, Florida, hosts...Ch. 3.4 - Pharmaceutical Company Sales. Annual sales, in...Ch. 3.4 - Cell Phone Companies Customer Satisfaction....Ch. 3.4 - Most Admired Companies. Fortune magazine’s list of...Ch. 3.4 - Prob. 54ECh. 3.5 - Five observations taken for two variables...Ch. 3.5 - Prob. 56ECh. 3.5 - The DATAfile TwoStocks contains adjusted monthly...Ch. 3.5 - Driving Speed and Fuel Efficiency. A department of...Ch. 3.5 - Smoke Detector Use and Death Rates. Over the past...Ch. 3.5 - Stock Market Indexes Comparison. The Russell 1000...Ch. 3.5 - Best Private Colleges. A random sample of 30...Ch. 3 - Americans Dining Out. Americans tend to dine out...Ch. 3 - NCAA Football Coaches Salaries. A 2017 USA Today...Ch. 3 - Physician Office Waiting Times. The average...Ch. 3 - Worker Productivity and Insomnia. U.S. companies...Ch. 3 - A study of smartphone users shows that 68% of...Ch. 3 - Work Commuting Methods. Public transportation and...Ch. 3 - Household Incomes. The following data represent a...Ch. 3 - Restaurant Chains’ Sales per Store. The data...Ch. 3 - Prob. 70SECh. 3 - NFL Teams Worth. In 2014, the 32 teams in the...Ch. 3 - MLB Team Winning Percentages. Does a major league...Ch. 3 - 73. The days to maturity for a sample of five...Ch. 3 - 74. Automobiles traveling on a road with a posted...Ch. 3 - Annual Returns for Panama Railroad Company Stock....Ch. 3 - Pelican Stores, a division of National Clothing,...Ch. 3 - The motion picture industry is a competitive...Ch. 3 - The pursuit of a higher education degree in...Ch. 3 - Although millions of elephants once roamed across...
Knowledge Booster
Background pattern image
Statistics
Learn more about
Need a deep-dive on the concept behind this application? Look no further. Learn more about this topic, statistics and related others by exploring similar questions and additional content below.
Similar questions
SEE MORE QUESTIONS
Recommended textbooks for you
  • Text book image
    College Algebra
    Algebra
    ISBN:9781337282291
    Author:Ron Larson
    Publisher:Cengage Learning
Text book image
College Algebra
Algebra
ISBN:9781337282291
Author:Ron Larson
Publisher:Cengage Learning
Solve ANY Optimization Problem in 5 Steps w/ Examples. What are they and How do you solve them?; Author: Ace Tutors;https://www.youtube.com/watch?v=BfOSKc_sncg;License: Standard YouTube License, CC-BY
Types of solution in LPP|Basic|Multiple solution|Unbounded|Infeasible|GTU|Special case of LP problem; Author: Mechanical Engineering Management;https://www.youtube.com/watch?v=F-D2WICq8Sk;License: Standard YouTube License, CC-BY
Optimization Problems in Calculus; Author: Professor Dave Explains;https://www.youtube.com/watch?v=q1U6AmIa_uQ;License: Standard YouTube License, CC-BY
Introduction to Optimization; Author: Math with Dr. Claire;https://www.youtube.com/watch?v=YLzgYm2tN8E;License: Standard YouTube License, CC-BY