
Modern Business Statistics with Microsoft Office Excel (with XLSTAT Education Edition Printed Access Card) (MindTap Course List)
6th Edition
ISBN: 9781337115186
Author: David R. Anderson, Dennis J. Sweeney, Thomas A. Williams, Jeffrey D. Camm, James J. Cochran
Publisher: Cengage Learning
expand_more
expand_more
format_list_bulleted
Videos
Textbook Question
Chapter 3, Problem 66SE
A study of smartphone users shows that 68% of smartphone use occurs at home and a user spends an average of 410 minutes per month using a smartphone to interact with other people (Harvard Business Review, January–February 2013). Consider the following data indicating the number of minutes in a month spent interacting with others via a smartphone for a sample of 50 smartphone users.
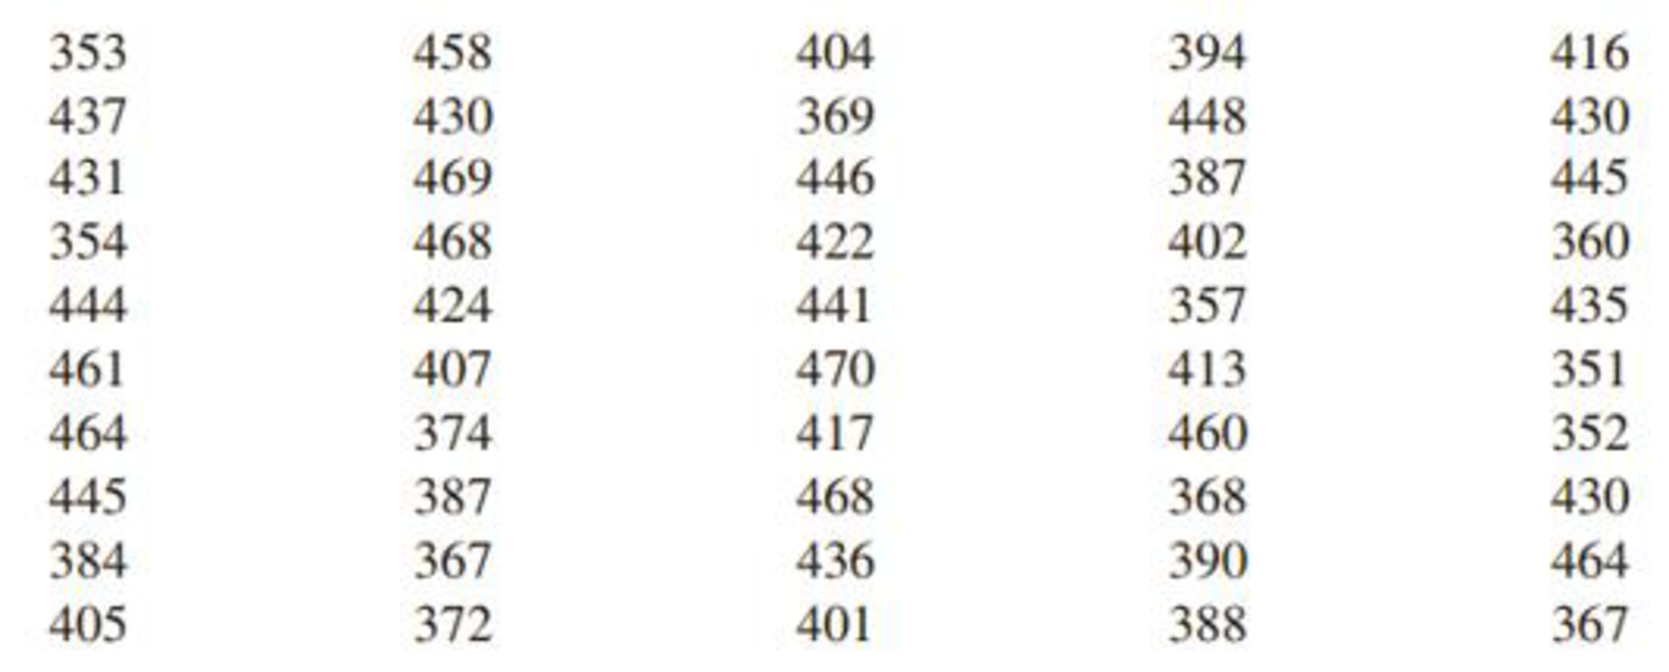
- a. What is the
mean number of minutes spent interacting with others for this sample? How does it compare to the mean reported in the study? - b. What is the standard deviation for this sample?
- c. Are there any outliers in this sample?
Expert Solution & Answer
Want to see the full answer?
Check out a sample textbook solution
Students have asked these similar questions
a small pond contains eight catfish and six bluegill. If seven fish are caught at random, what is the probability that exactly five catfish have been caught?
23 The line graph in the following figure shows
Revenue ($ millions)
one company's revenues over time. Explain
why this graph is misleading and what you
can do to fix the problem.
700
60-
50-
40
30
Line Graph of Revenue
20-
101
1950
1970
1975 1980 1985
Year
1990
2000
d of the
20
respectively.
Interpret the shape, center and spread of the
following box plot.
14
13
12
11
10
6
T
89
7
9
5.
治
Chapter 3 Solutions
Modern Business Statistics with Microsoft Office Excel (with XLSTAT Education Edition Printed Access Card) (MindTap Course List)
Ch. 3.1 - 1. Consider a sample with data values of 10, 20,...Ch. 3.1 - 2. Consider a sample with data values of 10, 20,...Ch. 3.1 - 3. Consider the following data and corresponding...Ch. 3.1 - Prob. 4ECh. 3.1 - Prob. 5ECh. 3.1 - Prob. 6ECh. 3.1 - 7. The average number of minutes Americans commute...Ch. 3.1 - Middle-Level Manager Salaries. Suppose that an...Ch. 3.1 - 9. Which companies spend the most money on...Ch. 3.1 - Advertising Spending. Which companies spend the...
Ch. 3.1 - Prob. 11ECh. 3.1 -
The Big Bang Theory, a situation comedy...Ch. 3.1 - Automobile Fuel Efficiencies. In automobile...Ch. 3.1 -
The data contained in the DATAfile named...Ch. 3.1 - 15. Martinez Auto Supplies has retail stores...Ch. 3.1 - 16. The grade point average for college students...Ch. 3.1 - 17. The following table shows the total return and...Ch. 3.1 - 18. Based on a survey of master’s programs in...Ch. 3.1 - Annual revenue for Corning Supplies grew by 5.5%...Ch. 3.1 - Suppose that at the beginning of Year 1 you...Ch. 3.1 - Prob. 21ECh. 3.1 - Prob. 22ECh. 3.2 - 23. Consider a sample with data values of 10, 20,...Ch. 3.2 - Prob. 24ECh. 3.2 - Consider a sample with data values of 27, 25, 20,...Ch. 3.2 - Price of Unleaded Gasoline. Data collected by the...Ch. 3.2 - Round-Trip Flight Prices. The following table...Ch. 3.2 -
The Australian Open is the first of the four...Ch. 3.2 - Air Quality Index. The Los Angeles Times regularly...Ch. 3.2 - Prob. 30ECh. 3.2 -
The results of Accounting Principals’ latest...Ch. 3.2 - Advertising Spend by Companies. Advertising Age...Ch. 3.2 - Scores turned in by an amateur golfer at the...Ch. 3.2 - Consistency of Running Times. The following times...Ch. 3.3 - 35. Consider a sample with data values of 10, 20,...Ch. 3.3 - 36. Consider a sample with a mean of 500 and a...Ch. 3.3 - 37. Consider a sample with a mean of 30 and a...Ch. 3.3 - 38. Suppose the data have a bell-shaped...Ch. 3.3 - 39. The results of a national survey showed that...Ch. 3.3 - 40. The energy information Administration reported...Ch. 3.3 - 41. The Graduate Management Admission Test (GMAT)...Ch. 3.3 - 42. Many families in California are using backyard...Ch. 3.3 -
According to a Los Angeles Times study of more...Ch. 3.3 - NCAA Basketball Game Scores. A sample of 10 NCAA...Ch. 3.3 -
The Wall Street Journal reported that Walmart...Ch. 3.4 - Consider a sample with data values of 27, 25, 20,...Ch. 3.4 - Prob. 47ECh. 3.4 - Prob. 48ECh. 3.4 - Prob. 49ECh. 3.4 - Naples Half-Marathon Times. Naples, Florida, hosts...Ch. 3.4 - Pharmaceutical Company Sales. Annual sales, in...Ch. 3.4 - Cell Phone Companies Customer Satisfaction....Ch. 3.4 - Most Admired Companies. Fortune magazine’s list of...Ch. 3.4 - Prob. 54ECh. 3.5 - Five observations taken for two variables...Ch. 3.5 - Prob. 56ECh. 3.5 - The DATAfile TwoStocks contains adjusted monthly...Ch. 3.5 - Driving Speed and Fuel Efficiency. A department of...Ch. 3.5 - Smoke Detector Use and Death Rates. Over the past...Ch. 3.5 - Stock Market Indexes Comparison. The Russell 1000...Ch. 3.5 - Best Private Colleges. A random sample of 30...Ch. 3 - Americans Dining Out. Americans tend to dine out...Ch. 3 - NCAA Football Coaches Salaries. A 2017 USA Today...Ch. 3 - Physician Office Waiting Times. The average...Ch. 3 - Worker Productivity and Insomnia. U.S. companies...Ch. 3 -
A study of smartphone users shows that 68% of...Ch. 3 - Work Commuting Methods. Public transportation and...Ch. 3 - Household Incomes. The following data represent a...Ch. 3 - Restaurant Chains’ Sales per Store. The data...Ch. 3 - Prob. 70SECh. 3 - NFL Teams Worth. In 2014, the 32 teams in the...Ch. 3 - MLB Team Winning Percentages. Does a major league...Ch. 3 - 73. The days to maturity for a sample of five...Ch. 3 - 74. Automobiles traveling on a road with a posted...Ch. 3 - Annual Returns for Panama Railroad Company Stock....Ch. 3 - Pelican Stores, a division of National Clothing,...Ch. 3 -
The motion picture industry is a competitive...Ch. 3 - The pursuit of a higher education degree in...Ch. 3 - Although millions of elephants once roamed across...
Knowledge Booster


Learn more about
Need a deep-dive on the concept behind this application? Look no further. Learn more about this topic, statistics and related others by exploring similar questions and additional content below.Similar questions
- F Make a box plot from the five-number summary: 100, 105, 120, 135, 140. harrow_forward14 Is the standard deviation affected by skewed data? If so, how? foldarrow_forwardFrequency 15 Suppose that your friend believes his gambling partner plays with a loaded die (not fair). He shows you a graph of the outcomes of the games played with this die (see the following figure). Based on this graph, do you agree with this person? Why or why not? 65 Single Die Outcomes: Graph 1 60 55 50 45 40 1 2 3 4 Outcome 55 6arrow_forward
- lie y H 16 The first month's telephone bills for new customers of a certain phone company are shown in the following figure. The histogram showing the bills is misleading, however. Explain why, and suggest a solution. Frequency 140 120 100 80 60 40 20 0 0 20 40 60 80 Telephone Bill ($) 100 120arrow_forward25 ptical rule applies because t Does the empirical rule apply to the data set shown in the following figure? Explain. 2 6 5 Frequency 3 сл 2 1 0 2 4 6 8 00arrow_forward24 Line graphs typically connect the dots that represent the data values over time. If the time increments between the dots are large, explain why the line graph can be somewhat misleading.arrow_forward
- 17 Make a box plot from the five-number summary: 3, 4, 7, 16, 17. 992) waarrow_forward12 10 - 8 6 4 29 0 Interpret the shape, center and spread of the following box plot. brill smo slob.nl bagharrow_forwardSuppose that a driver's test has a mean score of 7 (out of 10 points) and standard deviation 0.5. a. Explain why you can reasonably assume that the data set of the test scores is mound-shaped. b. For the drivers taking this particular test, where should 68 percent of them score? c. Where should 95 percent of them score? d. Where should 99.7 percent of them score? Sarrow_forward
- 13 Can the mean of a data set be higher than most of the values in the set? If so, how? Can the median of a set be higher than most of the values? If so, how? srit to estaarrow_forwardA random variable X takes values 0 and 1 with probabilities q and p, respectively, with q+p=1. find the moment generating function of X and show that all the moments about the origin equal p. (Note- Please include as much detailed solution/steps in the solution to understand, Thank you!)arrow_forward1 (Expected Shortfall) Suppose the price of an asset Pt follows a normal random walk, i.e., Pt = Po+r₁ + ... + rt with r₁, r2,... being IID N(μ, o²). Po+r1+. ⚫ Suppose the VaR of rt is VaRq(rt) at level q, find the VaR of the price in T days, i.e., VaRq(Pt – Pt–T). - • If ESq(rt) = A, find ES₁(Pt – Pt–T).arrow_forward
arrow_back_ios
SEE MORE QUESTIONS
arrow_forward_ios
Recommended textbooks for you
 Glencoe Algebra 1, Student Edition, 9780079039897...AlgebraISBN:9780079039897Author:CarterPublisher:McGraw Hill
 Big Ideas Math A Bridge To Success Algebra 1: Stu...AlgebraISBN:9781680331141Author:HOUGHTON MIFFLIN HARCOURTPublisher:Houghton Mifflin Harcourt
 Holt Mcdougal Larson Pre-algebra: Student Edition...AlgebraISBN:9780547587776Author:HOLT MCDOUGALPublisher:HOLT MCDOUGAL
 College Algebra (MindTap Course List)AlgebraISBN:9781305652231Author:R. David Gustafson, Jeff HughesPublisher:Cengage Learning
Glencoe Algebra 1, Student Edition, 9780079039897...
Algebra
ISBN:9780079039897
Author:Carter
Publisher:McGraw Hill
Big Ideas Math A Bridge To Success Algebra 1: Stu...
Algebra
ISBN:9781680331141
Author:HOUGHTON MIFFLIN HARCOURT
Publisher:Houghton Mifflin Harcourt
Holt Mcdougal Larson Pre-algebra: Student Edition...
Algebra
ISBN:9780547587776
Author:HOLT MCDOUGAL
Publisher:HOLT MCDOUGAL
College Algebra (MindTap Course List)
Algebra
ISBN:9781305652231
Author:R. David Gustafson, Jeff Hughes
Publisher:Cengage Learning
Introduction to experimental design and analysis of variance (ANOVA); Author: Dr. Bharatendra Rai;https://www.youtube.com/watch?v=vSFo1MwLoxU;License: Standard YouTube License, CC-BY