
Introduction to Statistics and Data Analysis
5th Edition
ISBN: 9781305445963
Author: PECK
Publisher: Cengage
expand_more
expand_more
format_list_bulleted
Videos
Textbook Question
Chapter 3, Problem 71CR
Americium 241 (241Am) is a radioactive material used in the manufacture of smoke detectors. The article “Retention and Dosimetry of Injected 241Am in Beagles” (Radiation Research [1984]: 564–575) described a study in which 55 beagles were injected with a dose of 241 Am (proportional to each animal’s weight). Skeletal retention of 241 Am (in microcuries per kilogram) was recorded for each beagle, resulting in the foil owing data:
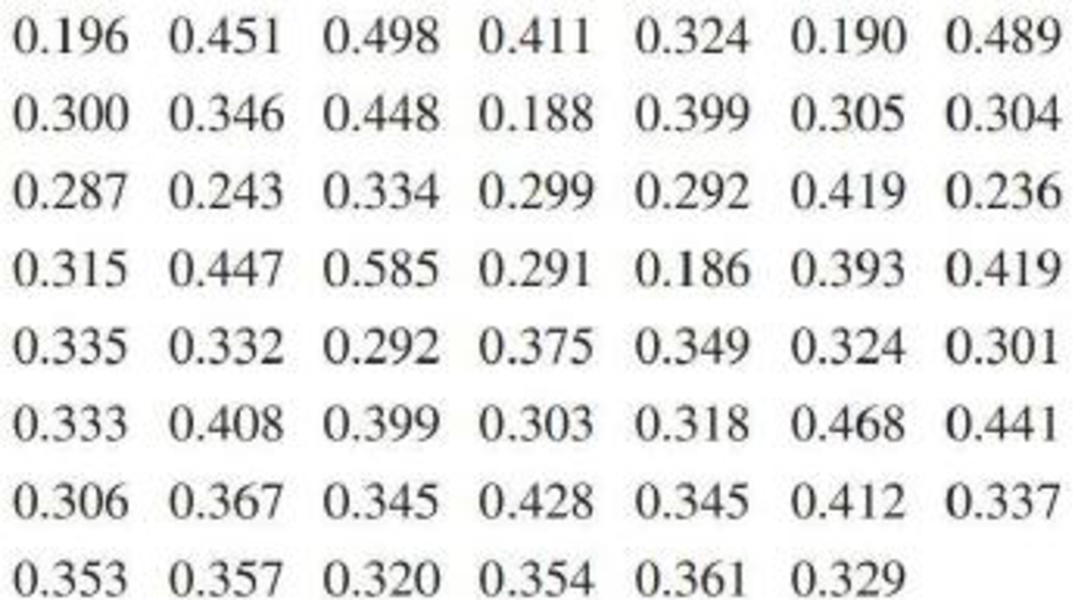
- a. Construct a frequency distribution for these data, and draw the corresponding histogram.
- b. Write a short description of the important features of the shape of the histogram.
Expert Solution & Answer
Want to see the full answer?
Check out a sample textbook solution
Students have asked these similar questions
An article reported on a study in which each of 13 workers was provided with both a conventional shovel and a shovel whose blade was perforated with small holes. The authors of the cited article provided the following data on energy expenditure
[kcal/kg(subject)/lb(clay)].
Worker:
2
4
5
6
Conventional: 0.0015 0.0015 0.0018 0.0022 0.001
0.0016 0.0028
Perforated:
0.0015 0.001
0.0019 0.0013 0.0011
0.0017 0.0024
Worker:
10
11
12
13
Conventional: 0.0021 0.0015 0.0014 0.0023 0.0017 0.002
Perforated:
0.0021 0.0013 0.0013 0.0017 0.0015
0.0013
n USE SALT
Do these data provide convincing evidence that the mean energy expenditure using the conventional shovel exceeds that using the perforated shovel? Test the relevant hypotheses using a significance level of 0.05. (Use SALT to calculate the P-value. Use
Hd = Hconventional - Hperforated Round your test statistic to one decimal place and your P-value to three decimal places.)
t=
df =
p-value =
State your conclusion.
O we fail to reject H,. We have…
Americium 241 (241 Am) is a radioactive material used in the manufacture of
241
smoke detectors. An article described a study in which 55 beagles were injected
with a dose of Am (proportional to each animal's weight). Skeletal retention of
241 Am (in microcuries per kilogram) was recorded for each beagle, resulting in the
following data:
0.196
0.3
0.287
0.315
0.335
0.333
0.306
0.353
0.301
0.441
0.337
0.451
0.346
0.243
0.447
0.332
0.408
0.367
0.357
0.304
0.236
0.419
Answer:
0.498
0.448
0.334
0.585
0.292
0.399
0.345
0.32
0.489
0.354
0.428
0.411
0.188
0.299
0.291
0.375
0.303
0.186
0.349
0.318
0.345
0.361
0.324
0.399
0.292
0.19
0.305
0.419
0.393
0.324
0.468
0.412
0.329
By constructing an equal width GFDT (for the given dataset) with six classes and
class width (using the given formula in Lecture note II) to be rounded to the nearest
hundredth, what proportion of these observations are not less than 0.326? (Type
your answer in decimal form, like 0.23)
Americium 241 (241 Am) is a radioactive material used in the manufacture of
241
smoke detectors. An article described a study in which 55 beagles were injected
with a dose of Am (proportional to each animal's weight). Skeletal retention of
241 Am (in microcuries per kilogram) was recorded for each beagle, resulting in the
following data:
0.196
0.3
0.287
0.315
0.335
0.333
0.306
0.353
0.301
0.441
0.337
0.451
0.346
0.243
0.447
0.332
0.408
0.367
0.357
0.304
0.236
0.419
Answer:
0.498
0.448
0.334
0.585
0.292
0.399
0.345
0.32
0.489
0.354
0.428
0.411
0.188
0.299
0.291
0.375
0.303
0.186
0.349
0.318
0.345
0.361
0.324
0.399
0.292
0.19
0.305
0.419
0.393
0.324
0.468
0.412
0.329
By constructing an equal width GFDT (for the given dataset) with six classes and
class width (using the given formula in Lecture note II) to be rounded to the nearest
hundredth, what proportion of these observations are not less than 0.395 but less
than or equal 0.535? (Type your answer in decimal form and round it to the…
Chapter 3 Solutions
Introduction to Statistics and Data Analysis
Ch. 3.1 - Each person in a nationally representative sample...Ch. 3.1 - The graphical display on the next page is similar...Ch. 3.1 - Prob. 3ECh. 3.1 - The National Confectioners Association asked 1006...Ch. 3.1 - College student attitudes about e-books were...Ch. 3.1 - Prob. 6ECh. 3.1 - Prob. 7ECh. 3.1 - Prob. 8ECh. 3.1 - Prob. 9ECh. 3.1 - The survey on student attitude toward e-books...
Ch. 3.1 - Prob. 11ECh. 3.1 - Prob. 12ECh. 3.1 - An article about college loans (New Rules Would...Ch. 3.1 - Prob. 14ECh. 3.2 - Prob. 15ECh. 3.2 - Prob. 16ECh. 3.2 - Prob. 17ECh. 3.2 - The article Economy Low, Generosity High (USA...Ch. 3.2 - Prob. 19ECh. 3.2 - A report from Texas Transportation Institute...Ch. 3.2 - The percentage of teens not in school or working...Ch. 3.3 - Prob. 22ECh. 3.3 - The accompanying data on annual maximum wind speed...Ch. 3.3 - The accompanying relative frequency table is based...Ch. 3.3 - Prob. 25ECh. 3.3 - Medicares new medical plans offer a wide range of...Ch. 3.3 - The following two relative frequency distributions...Ch. 3.3 - Prob. 28ECh. 3.3 - The report Trends in College Pricing 2012...Ch. 3.3 - An exam is given to students in an introductory...Ch. 3.3 - The accompanying frequency distribution summarizes...Ch. 3.3 - Example 3.19 used annual rainfall data for...Ch. 3.3 - Prob. 33ECh. 3.3 - Prob. 34ECh. 3.3 - Prob. 35ECh. 3.3 - Prob. 36ECh. 3.3 - Using the five class intervals 100 to 120, 120 to...Ch. 3.4 - Prob. 38ECh. 3.4 - Consumer Reports Health (consumerreports.org) gave...Ch. 3.4 - Prob. 40ECh. 3.4 - Prob. 41ECh. 3.4 - Prob. 42ECh. 3.4 - Prob. 43ECh. 3.4 - Prob. 44ECh. 3.4 - The accompanying time series plot of movie box...Ch. 3.5 - The accompanying comparative bar chart is similar...Ch. 3.5 - Prob. 47ECh. 3.5 - The figure at the top right of the next page is...Ch. 3.5 - The two graphical displays below are similar to...Ch. 3.5 - The following graphical display is similar to one...Ch. 3.5 - Explain why the following graphical display...Ch. 3 - Prob. 52CRCh. 3 - Prob. 53CRCh. 3 - Prob. 54CRCh. 3 - The Connecticut Agricultural Experiment Station...Ch. 3 - The stem-and-leaf display of Exercise 3.55 uses...Ch. 3 - Prob. 57CRCh. 3 - Prob. 58CRCh. 3 - Does the size of a transplanted organ matter? A...Ch. 3 - Prob. 60CRCh. 3 - Prob. 61CRCh. 3 - Prob. 62CRCh. 3 - The article Tobacco and Alcohol Use in G-Rated...Ch. 3 - Prob. 64CRCh. 3 - Prob. 65CRCh. 3 - Prob. 66CRCh. 3 - Prob. 67CRCh. 3 - Prob. 68CRCh. 3 - Prob. 69CRCh. 3 - Many nutritional experts have expressed concern...Ch. 3 - Americium 241 (241Am) is a radioactive material...Ch. 3 - Does eating broccoli reduce the risk of prostate...Ch. 3 - An article that appeared in USA TODAY (August 11,...Ch. 3 - Sometimes samples are composed entirely of...Ch. 3 - Prob. 4CRECh. 3 - More than half of Californias doctors say they are...Ch. 3 - Based on observing more than 400 drivers in the...Ch. 3 - An article from the Associated Press (May 14,...Ch. 3 - Prob. 8CRECh. 3 - Prob. 9CRECh. 3 - Prob. 10CRECh. 3 - The article Determination of Most Representative...Ch. 3 - The paper Lessons from Pacemaker Implantations...Ch. 3 - How does the speed of a runner vary over the...Ch. 3 - Prob. 14CRECh. 3 - One factor in the development of tennis elbow, a...Ch. 3 - An article that appeared in USA TODAY (September...
Additional Math Textbook Solutions
Find more solutions based on key concepts
In Exercises 9-20, use the data in the following table, which lists drive-thru order accuracy at popular fast f...
Essentials of Statistics (6th Edition)
Why is it difficult to define quality?
Introduction to Statistical Quality Control
A simple random sample of 200 third-graders in a large school district was chosen to participate in an after-sc...
Essential Statistics
Ten equally qualified marketing assistants are candidates for promotion to associate buyer; seven are men and t...
An Introduction to Mathematical Statistics and Its Applications (6th Edition)
Teacher Salaries
The following data from several years ago represent salaries (in dollars) from a school distri...
Elementary Statistics: A Step By Step Approach
c
Solve.
70. Copy Center Account. Rachel’s copy-center bill for July was $327. She made a payment of $200 and t...
Developmental Mathematics (9th Edition)
Knowledge Booster


Learn more about
Need a deep-dive on the concept behind this application? Look no further. Learn more about this topic, statistics and related others by exploring similar questions and additional content below.Similar questions
- A sociologist wants to determine if the life expectancy of people in Africa is less than the life expectancy of people in Asia. The data obtained is shown in the table below. Africa Asia = 63.3 yr. 1 X,=65.2 yr. 2 o, = 9.1 yr. = 7.3 yr. n1 = 120 = 150arrow_forwardIn a study of exhaust emissions from school buses, the pollution intake by passengers was determined for a sample of nine school buses used in the Southern California Air Basin. The pollution intake is the amount of exhaust emissions, in grams per person, that would be inhaled while traveling on the bus during its usual 1818‑mile trip on congested freeways from South Central LA to a magnet school in West LA. (As a reference, the average intake of motor emissions of carbon monoxide in the LA area is estimated to be about 0.0000460.000046 grams per person.) The amounts for the nine buses when driven with the windows open are given. 1.151.15 0.330.33 0.400.40 0.330.33 1.351.35 0.380.38 0.250.25 0.400.40 0.350.35 A good way to judge the effect of outliers is to do your analysis twice, once with the outliers and a second time without them. Give two 90%90% confidence intervals, one with all the data and one with the outliers removed, for the mean pollution intake among all school buses…arrow_forward3.24 An article in the ACI Materials Journal (Vol. 84, 1987, pp. 213–216) describes several experiments investigating the rodding of concrete to remove entrapped air. A 3-inch × 6-inch cylinder was used, and the number of times this rod was used is the design variable. The resulting compressive strength of the concrete specimen is the response. The data are shown in the following table: Rodding Level Compressive Strength 10 1530 1530 1440 15 1610 1650 1500 20 1560 1730 1530 25 1500 1490 1510 Refer to the data above. Construct the ANOVA table manually. Show your calculation to find a. SSTotal b. SSTreatment c. SSError d. Degree of freedom e. Mean square error f. F statisticsarrow_forward
- Analysis of several plant-food preparations for potassium ion yielded the following data:arrow_forwardA study published by Babcock and Marks (2010) showed that the average full-time U.S. college student studied for μ = 14 hours per week (SD = 4.8 hours per week) in 2005. We want to know if this average has changed in the past 15 years. In other words, we are going to do a study in which we try to determine whether there has been an impact of the passage of time on the amount of time college students spend studying. We selected a sample of n = 64 of today’s college students and find that they spent an average of M = 12.5 hours per week studying. Does this sample indicate a significant change in the number of hours spent studying? Use a two-tailed test (this means non-directional hypothesis) with α = .05.arrow_forwardThe article refered to in Exercise 1 also considered the effect of gypsum on the electric conductivity (in dS m) of soil. Two types of soil were each treated with three different amounts of gypsum, with two replicates for each soil-gypsum combination. The data are presented in the following table. Soil Type Gypsum (g/kg) Las Animas Madera 0.00 1.52 1.05 1.01 0.92 0.27 1.49 0.91 1.12 0.92 0.46 0.9 0.92 0.88 0.92 Is there convincing evidence of an interaction between the amount of gypsum and soil type? Can you conclude that the conductivity differs among the soil types? Can you conclude that the conductivity differs with the amount of gypsum added? C.arrow_forward
- In an article in IEEE Transactions on Instrumentation and Measurement (2001, Vol. 50, pp. 986-990), researchers reported on a study of the effects of reducing current draw in a magnetic core by electronic means. They measured the current in a magnetic winding with and without the electronics in a paired experiment. Data for the case without electronics are provided in the Table. Current Without Electronics (mA) Supply Voltage 0.66 7.32 1.32 12.22 1.98 16.34 2.64 23.66 3.3 28.06 3.96 33.39 4.62 34.12 3.28 39.21 5.94 44.21 6.6 47.48 (a) Fit a regression line to predict current without electronics to supply voltage. Is there a significant regression at a = 0.05? What is the P-value? (b) Estimate the correlation coefficient. (c) Test the hypothesis that p = 0 against the alternative p=0 with a = 0.05. What is the P-value?arrow_forwardIn an article in IEEE Transactions on Instrumentation and Measurement (2001, Vol. 50, pp. 986-990), researchers reported on a study of the effects of reducing current draw in a magnetic core by electronic means. They measured the current in a magnetic winding with and without the electronics in a paired experiment. Data for the case without electronics are provided in the Table. Current Without Electronics (mA) Supply Voltage 0.66 7.32 1.32 12.22 1.98 16.34 2.64 23.66 3.3 28.06 3.96 33.39 4.62 34.12 3.28 39.21 5.94 44.21 6.6 47.48 (a) Estimate the correlation coefficient. (b) Test the hypothesis that p = 0 against the alternative p=0 with a = 0.05. What is the P-value? (c) Compute a 95% confidence interval for the correlation coefficient.arrow_forwardAn environmental group took a sample from a river under study to check on the biochemical oxygen demand (BOD) of the organisms living in the river. The BOD test was conducted over a period of time (in days). The resulting data follow: Time (days): 1 2 4 6 8 10 12 14 18 20 BOD (mg/liter) 0.6 0.7 1.5 1.9 2.1 2.6 2.9 3.7 3.7 3.8 23 16 3.5arrow_forward
- An automobile dealer conducted a test to determine if the time in minutes needed to complete a minor engine tune-up depends on whether a computerized engine analyzer or an electronic analyzer is used. Because tune-up time varies among compact, intermediate, and full-sized cars, the three types of cars were used as blocks in the experiment. The data obtained follow. Analyzer Computerized Electronic Compact 50 41 Car Intermediate 56 44 Full-sized 62 47 Use a = 0.05 to test for any significant differences. State the null and alternative hypotheses. O Ho: Hcompact * HIntermediate * HFull-sized Ha: "Compact = HIntermediate = 4Full-sized O Ho: HComputerized * HElectronic Ha: HComputerized = HElectronic O Ho: HComputerized = HElectronic Ha: "Computerized * HElectronic O Ho: HComputerized = HElectronic = "Compact = HIntermediate = "Full-sized H.: Not all the population means are equal. O Ho: HCompact = HIntermediate = HFull-sized Hai H compact * HIntermediate * HFull-sized Find the value of…arrow_forwardA special education teacher did research on whether or not there is a relationship between the number of students in his class and the number incidents of “acting out” behaviors exhibited by the autistic students in the classroom. He collects data for a year and aggregates them by month. He obtained the statistics below, r= -.863 R2=.74 b= -1.212294 a= 131.176598 10.) How does the presence of more students affect the incidents in the class? a) as students are added the incidences increase b) as students are added the incidences decrease c) the number of students does not affect acting out d) the number of students caused more incidents How much of the variability of acting out is explained by the number of students in the class?___________arrow_forwardA study of the effect of caffeine on muscle metabolism used eighteen male volunteers who each underwent arm exercise tests. Nine of the men were randomly selected to take a capsule containing pure caffeine one hour before the test. The other men received a placebo capsule. During each exercise the subject's respiratory exchange ratio (RER) was measured. (RER is the ratio of CO2 produced to O2 consumed and is an indicator of whether energy is being obtained from carbohydrates or fats). The question of interest to the experimenter was whether, on average, caffeine changes RER. The two populations being compared are “men who have not taken caffeine” and “men who have taken caffeine” the results were as follows: Develop the hypothesis, Do the test Write the result of the hypothesisarrow_forward
arrow_back_ios
SEE MORE QUESTIONS
arrow_forward_ios
Recommended textbooks for you
 Glencoe Algebra 1, Student Edition, 9780079039897...AlgebraISBN:9780079039897Author:CarterPublisher:McGraw Hill
Glencoe Algebra 1, Student Edition, 9780079039897...
Algebra
ISBN:9780079039897
Author:Carter
Publisher:McGraw Hill
Hypothesis Testing using Confidence Interval Approach; Author: BUM2413 Applied Statistics UMP;https://www.youtube.com/watch?v=Hq1l3e9pLyY;License: Standard YouTube License, CC-BY
Hypothesis Testing - Difference of Two Means - Student's -Distribution & Normal Distribution; Author: The Organic Chemistry Tutor;https://www.youtube.com/watch?v=UcZwyzwWU7o;License: Standard Youtube License