
Concept explainers
Videos
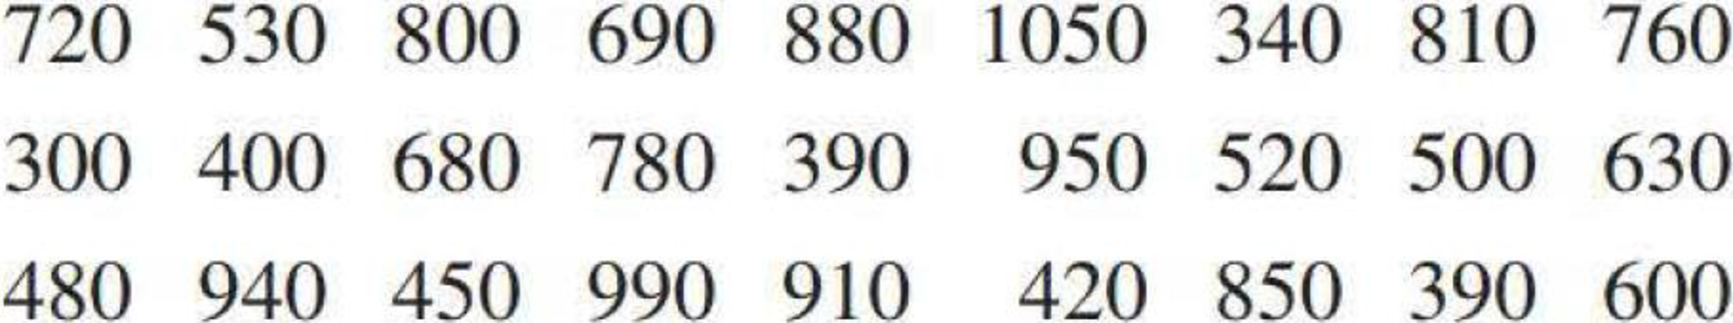
Many nutritional experts have expressed concern about the high levels of sodium in prepared foods. The following data on sodium content (in milligrams) per frozen meal appeared in the article “Comparison of ‘Light’ Frozen Meals” (Boston Globe, April 24, 1991):
Two histograms for these data are shown below and on the next page.
- a. Do the two histograms give different impressions about the distribution of values?
- b. Use each histogram to determine the approximate proportion of observations that are less than 800, and compare to the actual proportion.
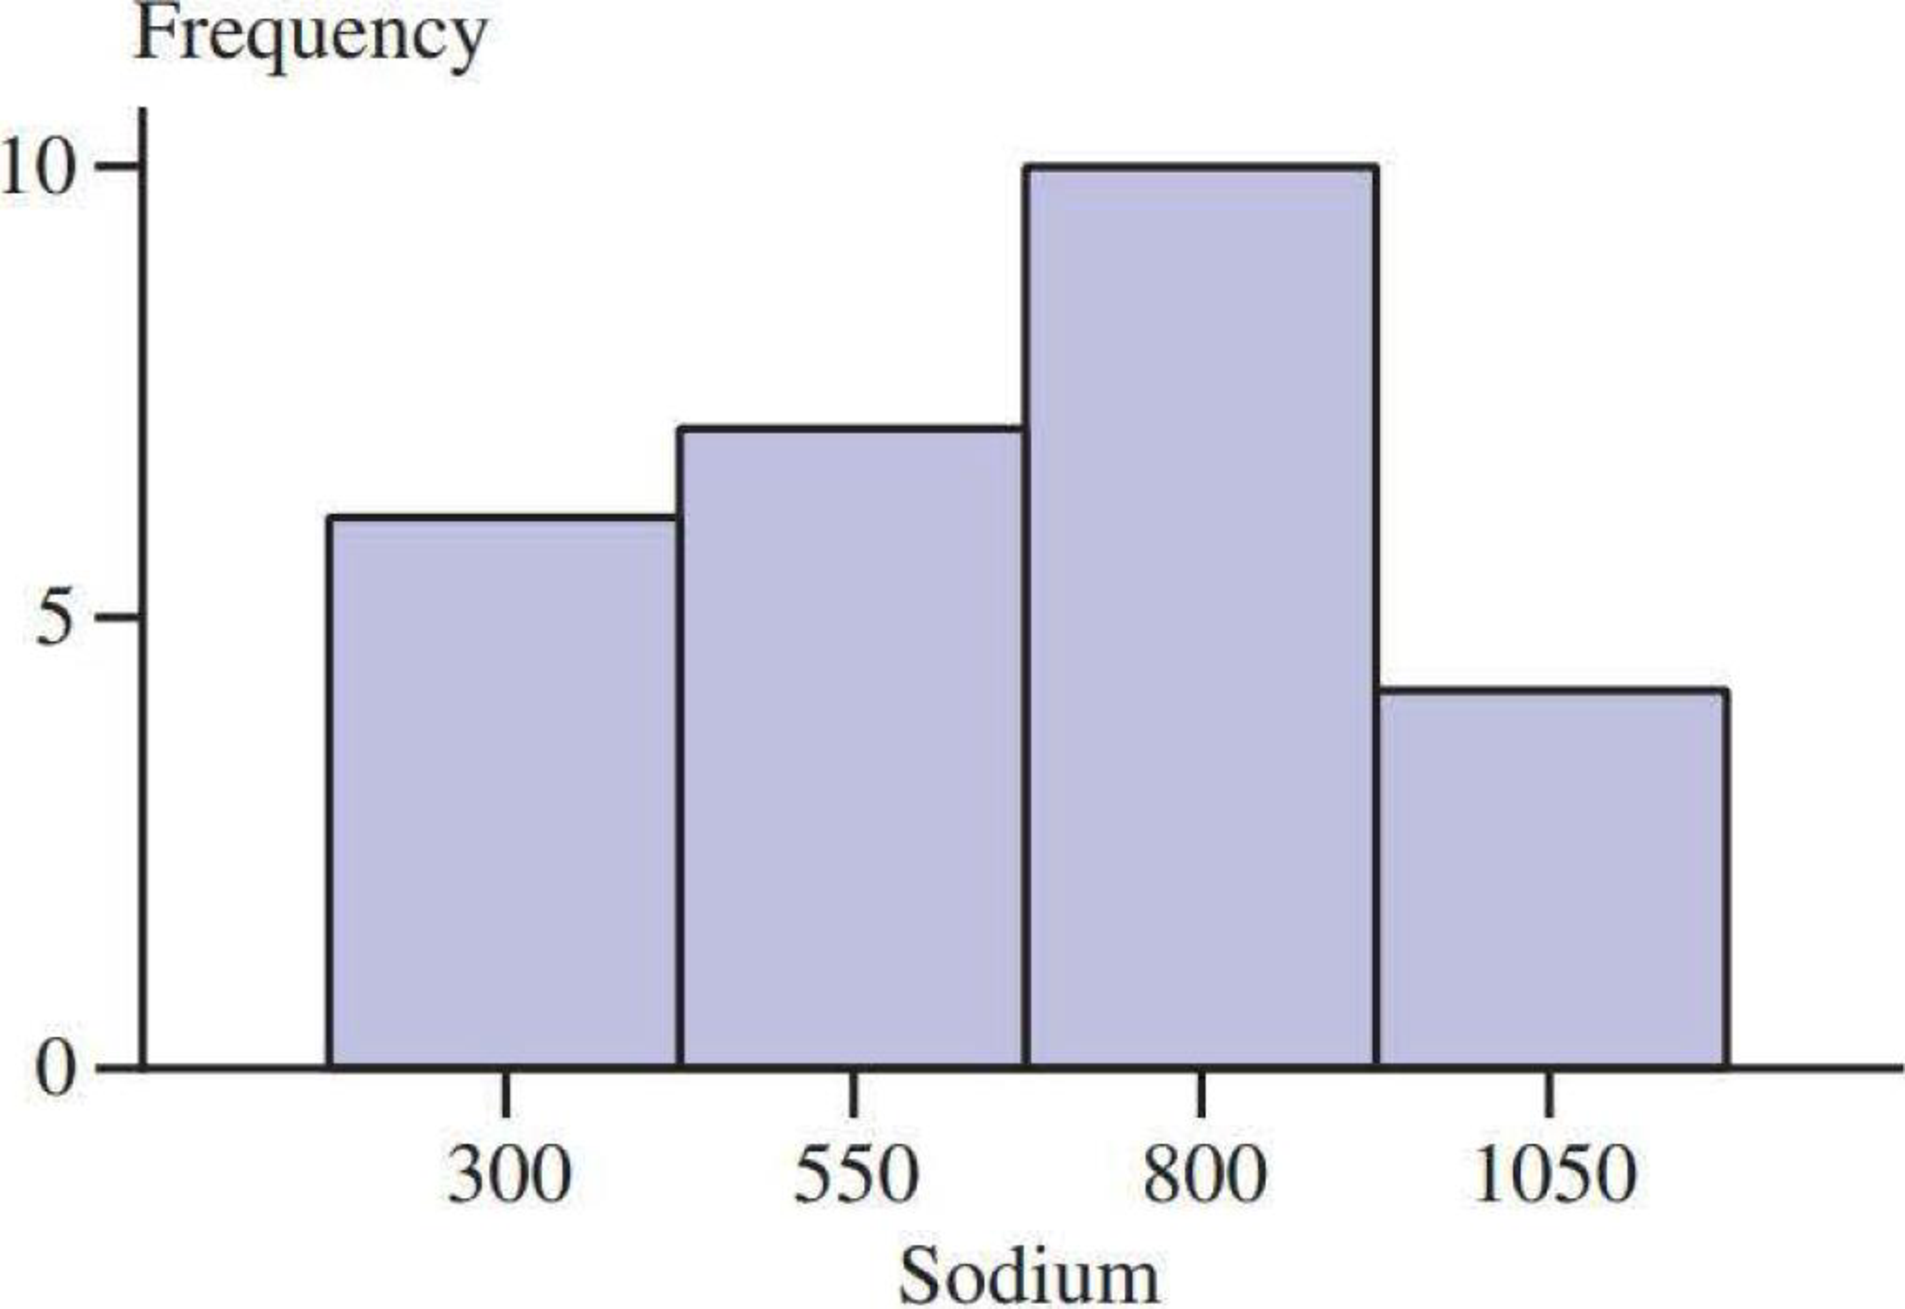
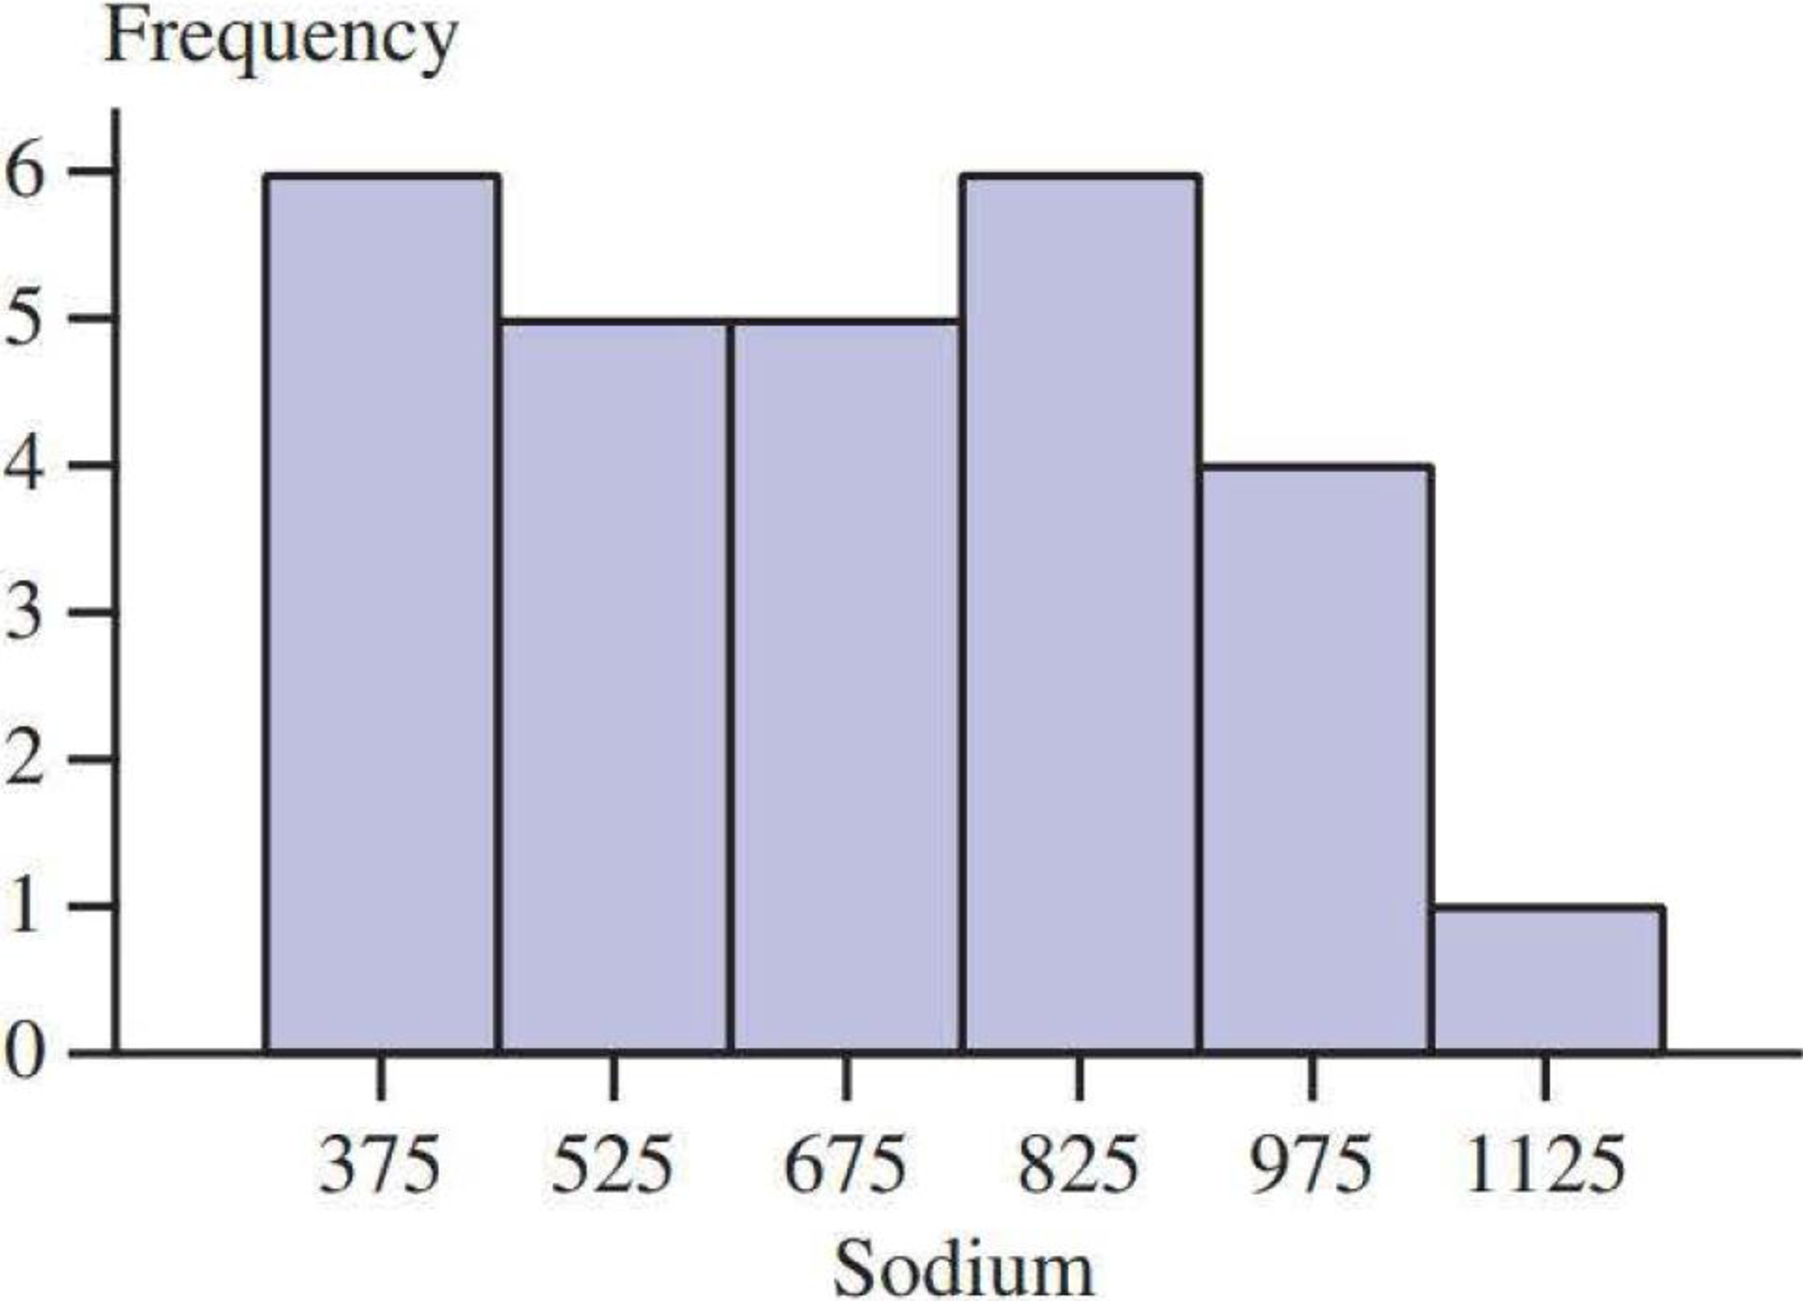
a.
Check whether the interpretations of two histograms are different.
Answer to Problem 70CR
Yes, the two histograms give different impressions about the data of sodium content.
Explanation of Solution
The data represents the sodium content per frozen meal.
Skewness:
In statistics, skewness is a measure by which anyone can measure the asymmetrical behavior of a distribution.
A distribution is said to be symmetric, when its mean, median, and mode are the same. In other words it can be said that, the length of the curve of the left-hand tail will be a mirror image of the right-hand tail.
Therefore, the shape of a distribution can be identified by using the measure of skewness.
Left-skewed:
For a left-skewed distribution,
Right-skewed:
For a right-skewed distribution,
Since, the length of the curve of left-hand tail is greater than the right-hand tail, the first histogram indicates that, the distribution of sodium content is negatively skewed.
Since, the length of the curve of right-hand tail is greater than the left-hand tail, the second histogram indicates that, the distribution of sodium content is positively skewed.
Thus, the two histograms give different impressions about the data of sodium content.
b.
Find the proportion of observations that are less than 800 from the first histogram.
Compute the proportion of observations that are less than 800 from the second histogram.
Answer to Problem 70CR
The proportion of observations that are less than 800 from the first histogram is 0.6667.
The proportion of observations that are less than 800 from the second histogram is 0.6667.
Explanation of Solution
The general formula for the relative frequency or proportion is,
First histogram:
From the first histogram display, it can be seen that the frequency of the sodium content that is less than 800 is
The proportion of sodium content that is less than 800 is obtained as:
Substituting the values of sodium content that is less than “18” as the frequency and total frequency as “27”,
Thus, nearly 66.67% of sodium content is less than 800.
Second histogram:
The Objective is to find the frequency of sodium content that is less than 800.
The class width of class intervals is 150. The fourth interval is between 750 and 900.
The approximate range of less than 800 is 1/3rd part of the class interval 750 and 900.
Hence, the frequency of the sodium content that is less than 800 is
The proportion of sodium content that is less than 800 is obtained as:
Substituting the values of sodium content that is less than “18” as the frequency and total frequency as “27”,
Thus, nearly 66.67% of sodium content is less than 800.
Want to see more full solutions like this?
Chapter 3 Solutions
Introduction to Statistics and Data Analysis
Additional Math Textbook Solutions
Precalculus: A Unit Circle Approach (3rd Edition)
APPLIED STAT.IN BUS.+ECONOMICS
University Calculus: Early Transcendentals (4th Edition)
Introductory Statistics
A Problem Solving Approach To Mathematics For Elementary School Teachers (13th Edition)


- Let X be a random variable with support SX = {−3, 0.5, 3, −2.5, 3.5}. Part ofits probability mass function (PMF) is given bypX(−3) = 0.15, pX(−2.5) = 0.3, pX(3) = 0.2, pX(3.5) = 0.15.(a) Find pX(0.5).(b) Find the cumulative distribution function (CDF), FX(x), of X.1(c) Sketch the graph of FX(x).arrow_forwardA well-known company predominantly makes flat pack furniture for students. Variability with the automated machinery means the wood components are cut with a standard deviation in length of 0.45 mm. After they are cut the components are measured. If their length is more than 1.2 mm from the required length, the components are rejected. a) Calculate the percentage of components that get rejected. b) In a manufacturing run of 1000 units, how many are expected to be rejected? c) The company wishes to install more accurate equipment in order to reduce the rejection rate by one-half, using the same ±1.2mm rejection criterion. Calculate the maximum acceptable standard deviation of the new process.arrow_forward5. Let X and Y be independent random variables and let the superscripts denote symmetrization (recall Sect. 3.6). Show that (X + Y) X+ys.arrow_forward
- 8. Suppose that the moments of the random variable X are constant, that is, suppose that EX" =c for all n ≥ 1, for some constant c. Find the distribution of X.arrow_forward9. The concentration function of a random variable X is defined as Qx(h) = sup P(x ≤ X ≤x+h), h>0. Show that, if X and Y are independent random variables, then Qx+y (h) min{Qx(h). Qr (h)).arrow_forward10. Prove that, if (t)=1+0(12) as asf->> O is a characteristic function, then p = 1.arrow_forward
- 9. The concentration function of a random variable X is defined as Qx(h) sup P(x ≤x≤x+h), h>0. (b) Is it true that Qx(ah) =aQx (h)?arrow_forward3. Let X1, X2,..., X, be independent, Exp(1)-distributed random variables, and set V₁₁ = max Xk and W₁ = X₁+x+x+ Isk≤narrow_forward7. Consider the function (t)=(1+|t|)e, ER. (a) Prove that is a characteristic function. (b) Prove that the corresponding distribution is absolutely continuous. (c) Prove, departing from itself, that the distribution has finite mean and variance. (d) Prove, without computation, that the mean equals 0. (e) Compute the density.arrow_forward
- 1. Show, by using characteristic, or moment generating functions, that if fx(x) = ½ex, -∞0 < x < ∞, then XY₁ - Y2, where Y₁ and Y2 are independent, exponentially distributed random variables.arrow_forward1. Show, by using characteristic, or moment generating functions, that if 1 fx(x): x) = ½exarrow_forward1990) 02-02 50% mesob berceus +7 What's the probability of getting more than 1 head on 10 flips of a fair coin?arrow_forward
 Glencoe Algebra 1, Student Edition, 9780079039897...AlgebraISBN:9780079039897Author:CarterPublisher:McGraw Hill
 Big Ideas Math A Bridge To Success Algebra 1: Stu...AlgebraISBN:9781680331141Author:HOUGHTON MIFFLIN HARCOURTPublisher:Houghton Mifflin Harcourt
 Holt Mcdougal Larson Pre-algebra: Student Edition...AlgebraISBN:9780547587776Author:HOLT MCDOUGALPublisher:HOLT MCDOUGAL
 Functions and Change: A Modeling Approach to Coll...AlgebraISBN:9781337111348Author:Bruce Crauder, Benny Evans, Alan NoellPublisher:Cengage Learning