(a) Use the distance and velocity data in Figure 3.64 to find the rate of expansion as a function of distance. (b) If you extrapolate back in time, how long ago would all of the galaxies have been at approximately the same position? The two parts of this problem give you some idea of how the Hubble constant for universal expansion and the time back to the Big Bang are determined, respectively. Figure 3.64 Five galaxies on a straight line, showing their distances and velocities relative to the Milky Way (MW) Galaxy. The distances are in millions of light years (Mly), where a light year is the distance light travels in one year. The velocities are nearly proportional to the distances. The sizes of the galaxies are greatly exaggerated; an average galaxy is about 0.1 MlY across.
(a) Use the distance and velocity data in Figure 3.64 to find the rate of expansion as a function of distance. (b) If you extrapolate back in time, how long ago would all of the galaxies have been at approximately the same position? The two parts of this problem give you some idea of how the Hubble constant for universal expansion and the time back to the Big Bang are determined, respectively. Figure 3.64 Five galaxies on a straight line, showing their distances and velocities relative to the Milky Way (MW) Galaxy. The distances are in millions of light years (Mly), where a light year is the distance light travels in one year. The velocities are nearly proportional to the distances. The sizes of the galaxies are greatly exaggerated; an average galaxy is about 0.1 MlY across.
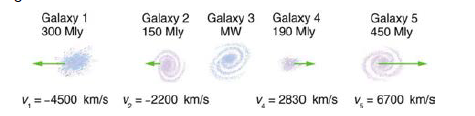
(a) Use the distance and velocity data in Figure 3.64 to find the rate of expansion as a function of distance. (b) If you extrapolate back in time, how long ago would all of the galaxies have been at approximately the same position? The two parts of this problem give you some idea of how the Hubble constant for universal expansion and the time back to the Big Bang are determined, respectively.
Figure 3.64 Five galaxies on a straight line, showing their distances and velocities relative to the Milky Way (MW) Galaxy. The distances are in millions of light years (Mly), where a light year is the distance light travels in one year. The velocities are nearly proportional to the distances. The sizes of the galaxies are greatly exaggerated; an average galaxy is about 0.1 MlY across.
Compare the slope of your Data Table 2 graph to the average wavelength (Ave, l) from Data Table 2 by calculating the % Difference. Is the % Difference calculated for the wavelength in Data Table 2 within an acceptable % error? Explain why or why not?
The slope of a graph of velocity, v, vs frequency, f, is equal to wavelength, l. Compare the slope of your Data Table 1 graph to the average wavelength (Ave, l) from Data Table 1 by calculating the % Difference.
Examine the slope of the line on the graph created using the data in Data Table 4 of Period, T2 vs L, the slope of the line is a constant containing the acceleration due to gravity, g. Using the slope of your line, determine the experimental value for g. Compare the value you determined for g from the slope of the graph to the expected value of 9.81 m/s2 by calculating the percent error.
Need a deep-dive on the concept behind this application? Look no further. Learn more about this topic, physics and related others by exploring similar questions and additional content below.


 Principles of Physics: A Calculus-Based TextPhysicsISBN:9781133104261Author:Raymond A. Serway, John W. JewettPublisher:Cengage Learning
 College PhysicsPhysicsISBN:9781938168000Author:Paul Peter Urone, Roger HinrichsPublisher:OpenStax College
 University Physics Volume 3PhysicsISBN:9781938168185Author:William Moebs, Jeff SannyPublisher:OpenStax
 Modern PhysicsPhysicsISBN:9781111794378Author:Raymond A. Serway, Clement J. Moses, Curt A. MoyerPublisher:Cengage Learning
 Glencoe Physics: Principles and Problems, Student...PhysicsISBN:9780078807213Author:Paul W. ZitzewitzPublisher:Glencoe/McGraw-Hill
 College PhysicsPhysicsISBN:9781305952300Author:Raymond A. Serway, Chris VuillePublisher:Cengage Learning