
Concept explainers
Videos
(a)
To Draw:
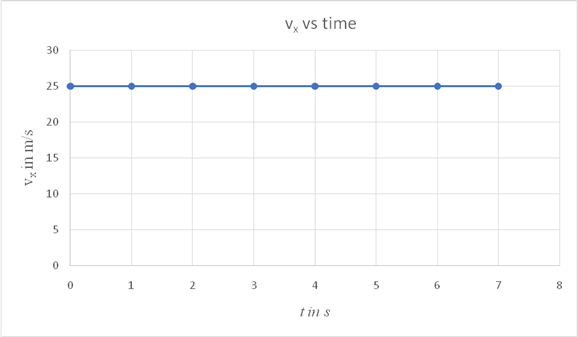
A graph of vx versus time for a projectile and identify the points where the object reaches its highest point and where it hits the ground at the end of its flight.
Explanation of Solution
Introduction:
Consider an object that undergoes a projectile motion. The object is projected with a velocity v at an angle θ to the horizontal. The velocity has an initial horizontal component
For the purpose of drawing a graph showing the variation of vx with time, assume the value of
On a spread sheet insert the values as shown and draw a graph as shown.
| t in s | vx in m/s |
| 0 | 25 |
| 1 | 25 |
| 2 | 25 |
| 3 | 25 |
| 4 | 25 |
| 5 | 25 |
| 6 | 25 |
| 7 | 25 |
Conclusion:
The graph is a straight line parallel to the time axis. From the above graph, it is not possible to identify the points where the object reaches its maximum height or when it reaches the ground, since the graph shows no variation of the horizontal component with time.
(b)
To Draw:
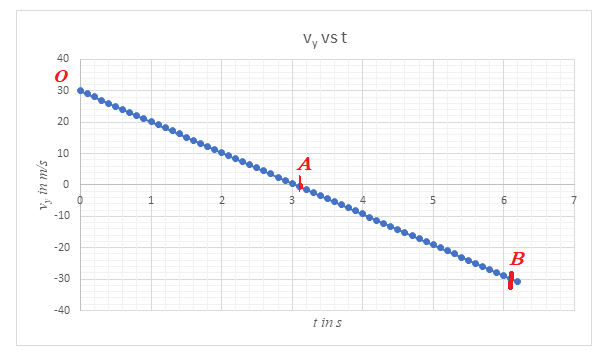
A graph of vy versus time for a projectile and identify the points where the object reaches its highest point and where it hits the ground at the end of its flight.
Explanation of Solution
Introduction:
Consider an object that undergoes a projectile motion. The object is projected with a velocity v at an angle θ to the horizontal. The velocity has an initial horizontal component
The projectile after it is launched is under the action of the acceleration of free fall. The vertical component of the projectile varies under the action of the acceleration due to gravity g.
The expression which shows the variation of vy with time is given by,
The acceleration due to gravity g is directed downwards, opposite to the direction of the vertical component of the velocity at the moment of launch. Therefore, it is given a value
Assume, the value of
On a spreadsheet, use the following equation to plot the variation of vy with time.
| t in s | vy in m/s |
| 0 | 30 |
| 0.1 | 29.019 |
| 0.2 | 28.038 |
| 0.3 | 27.057 |
| 0.4 | 26.076 |
| 0.5 | 25.095 |
| 0.6 | 24.114 |
| 0.7 | 23.133 |
| 0.8 | 22.152 |
| 0.9 | 21.171 |
| 1 | 20.19 |
| 1.1 | 19.209 |
| 1.2 | 18.228 |
| 1.3 | 17.247 |
| 1.4 | 16.266 |
| 1.5 | 15.285 |
| 1.6 | 14.304 |
| 1.7 | 13.323 |
| 1.8 | 12.342 |
| 1.9 | 11.361 |
| 2 | 10.38 |
| 2.1 | 9.399 |
| 2.2 | 8.418 |
| 2.3 | 7.437 |
| 2.4 | 6.456 |
| 2.5 | 5.475 |
| 2.6 | 4.494 |
| 2.7 | 3.513 |
| 2.8 | 2.532 |
| 2.9 | 1.551 |
| 3 | 0.57 |
| 3.1 | -0.411 |
| 3.2 | -1.392 |
| 3.3 | -2.373 |
| 3.4 | -3.354 |
| 3.5 | -4.335 |
| 3.6 | -5.316 |
| 3.7 | -6.297 |
| 3.8 | -7.278 |
| 3.9 | -8.259 |
| 4 | -9.24 |
| 4.1 | -10.221 |
| 4.2 | -11.202 |
| 4.3 | -12.183 |
| 4.4 | -13.164 |
| 4.5 | -14.145 |
| 4.6 | -15.126 |
| 4.7 | -16.107 |
| 4.8 | -17.088 |
| 4.9 | -18.069 |
| 5 | -19.05 |
| 5.1 | -20.031 |
| 5.2 | -21.012 |
| 5.3 | -21.993 |
| 5.4 | -22.974 |
| 5.5 | -23.955 |
| 5.6 | -24.936 |
| 5.7 | -25.917 |
| 5.8 | -26.898 |
| 5.9 | -27.879 |
| 6 | -28.86 |
| 6.1 | -29.841 |
| 6.2 | -30.822 |
From the graph, the following points are noted:
1.The maximum positive value of vy is at point O, which the point at which it is launched.
2. As the object rises, the vertical component of its velocity reduces under the action of acceleration due to gravity g. When it reaches the maximum height, this component attains a value zero. This is seen from the graph as point A. The time taken by this projectile to reach its maximum height is seen to be equal to 3.05 s.
3. As the object descends from the position of maximum height, the vertical component of its velocity is directed downwards and hence it has a negative value. Its value increases as it moves downwards, since now, the vertical component vy and the acceleration due to gravity are both directed downwards. When it hits the ground, the vertical component vy has a magnitude of 30 m/s and it is directed downwards, hence negative. Point B represents the point when it reaches the ground. The total time of flight from the graph is 6.1 s.
Conclusion:
The object with a vertical component of magnitude 30 m/s, reaches the position of maximum height in time 3.05 s and reaches the ground after 6.1 s. The graph varies linearly with time. The gradient of the graph is equal to g which has a value
(c)
To Draw:
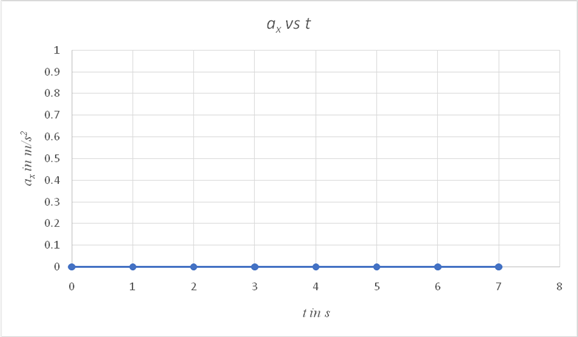
A graph showing the variation of ax with time.
Explanation of Solution
Introduction:
A projectile travels a parabolic path under the action of acceleration due to gravity, if no air resistance acts on it.
The only force acting on the projectile is the gravitational force, which is directed downwards, towards the center of the Earth. This force is constant at points close to the surface of the earth. Since it is directed towards the ground, it has no component along the horizontal direction. Hence,
On a spreadsheet, use
| tin s | ax in m/s2 |
| 0 | 0 |
| 1 | 0 |
| 2 | 0 |
| 3 | 0 |
| 4 | 0 |
| 5 | 0 |
| 6 | 0 |
| 7 | 0 |
Conclusion:
Since the only force acting on the projectile is the gravitational force and it has no component along the horizontal direction, the horizontal component of its acceleration is zero at all times, as shown in the graph.
(d)
To Draw:
A graph showing the variation of ay with time.
Explanation of Solution
Introduction:
A projectile travel in a parabolic path under the action of acceleration due to gravity. If no air resistance acts on the object, the only force acting on it is the gravitational force. Hence the vertical component of the object's acceleration is
The gravitational force is a constant at points close to the surface of the earth. The acceleration due to gravity has a constant value of
On a spreadsheet, use the expression
| tin s | ay in m/s2 |
| 0 | -9.81 |
| 1 | -9.81 |
| 2 | -9.81 |
| 3 | -9.81 |
| 4 | -9.81 |
| 5 | -9.81 |
| 6 | -9.81 |
| 7 | -9.81 |
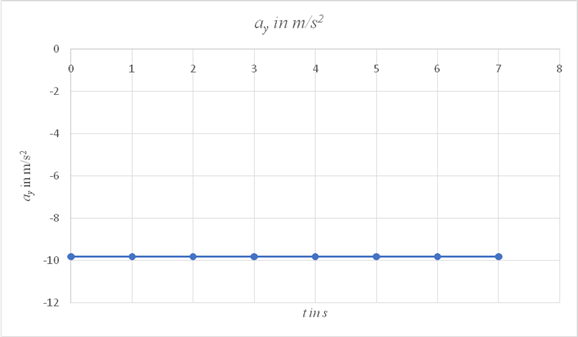
Conclusion:
The graph of ay vs time is a straight line parallel to the time axis and has a constant value of
Want to see more full solutions like this?
Chapter 3 Solutions
COLLEGE PHYSICS-ACHIEVE AC (1-TERM)


- Given: ruler 11.56 g, small washer 1.85 g each, large washer 24.30g each Use the data in Data Tables 4 and 5 to experimentally determine the mass of your ruler. Use one of your 2 trials with 1 small washer at 0 cm, one of your 2 trials with 2 small washers at 0 cm, and one of your 2 trials with 3 small washers at 0 cm to find three experimental values for the mass of the ruler. How do you experimentalls determine the mass?arrow_forwardCompare the 3 experimental masses of your ruler to the measured mass of your ruler (Data Table 1) by calculating the percent error for each experimental value. Which trial provided the best data for determining the mass of the ruler? Please help, I am not sure how to calculate this. Thanks!arrow_forwardPlease help, everytime I try to input the data only one point shows on the graph. Please graph unsing centripetal force, Fc, versus V E2 from Activity 1. Include a line of best fit and record the equation of the line. Thank you!arrow_forward
- Please help, everytime I try to input the data only one point shows on the graph. Graph of centripetal force, Fc, versus V E2 from Activity 1. Include a line of best fit and record the equation of the line.arrow_forwardBased on your graph, explain how centripetal force is affected when the hanging mass changes. Does your graph verify the relationship in the equation r = x^i + y^j = r cos ωt I + r sin ωt^j?arrow_forwardDid your experiment results in Data Table 3 verify, to within a reasonable experimental error, the condition of equilibrium of Equation 6: Στanti-clockwise = Στclockwise? Support your response with experimental data. My data shows that they are not equal to each other. So what does this mean? Thanks!arrow_forward
- Please help, everytime I try to input the data only one point shows on the graph. Graph of centripetal force, Fc, versus V E2 from Activity 1. Include a line of best fit and record the equation of the line.arrow_forwardExplain how your experiment met the condition for equilibrium in Equation 4: ΣFvertical = ΣFy = 0.arrow_forwardCan i get answer and solution for this question and can you teach me What we use to get the answer.arrow_forward
- Can i get answer and solution and can you teach me how to get it.arrow_forwardConsider a image that is located 30 cm in front of a lens. It forms an upright image 7.5 cm from the lens. Theillumination is so bright that that a faint inverted image, due to reflection off the front of the lens, is observedat 6.0 cm on the incident side of the lens. The lens is then turned around. Then it is observed that the faint,inverted image is now 10 cm on the incident side of the lens.What is the index of refraction of the lens?arrow_forward2. In class, we discussed several different flow scenarios for which we can make enough assumptions to simplify the Navier-Stokes equations enough to solve them and obtain an exact solution. Consulting the cylindrical form of the Navier-Stokes equations copied below, please answer the following questions. др a 1 a + +0x- + +O₂ = Pgr + μl 18²v, 2 ave ²v₁] az2 + at or r de r Əz dr ar Vodvz др [18 + + +Or + +Vz = Pgz +fl at ar r 20 ôz ôz dr ave дов V,Ve ave +Or + + = pge at dr r 80 Əz + az2 a.) In class, we discussed how the Navier-Stokes equations are an embodiment of Newton's 2nd law, F = ma (where bolded terms are vectors). Name the 3 forces that we are considering in our analysis of fluid flow for this class. др a 10 1 ve 2 av 2200] + +μ or 42 30 b.) If we make the assumption that flow is "fully developed" in the z direction, which term(s) would go to zero? Write the term below, describe what the term means in simple language (i.e. do not simply state "it is the derivative of a with…arrow_forward
 Glencoe Physics: Principles and Problems, Student...PhysicsISBN:9780078807213Author:Paul W. ZitzewitzPublisher:Glencoe/McGraw-Hill
 An Introduction to Physical SciencePhysicsISBN:9781305079137Author:James Shipman, Jerry D. Wilson, Charles A. Higgins, Omar TorresPublisher:Cengage Learning
 College PhysicsPhysicsISBN:9781305952300Author:Raymond A. Serway, Chris VuillePublisher:Cengage Learning
 College PhysicsPhysicsISBN:9781285737027Author:Raymond A. Serway, Chris VuillePublisher:Cengage Learning
 University Physics Volume 1PhysicsISBN:9781938168277Author:William Moebs, Samuel J. Ling, Jeff SannyPublisher:OpenStax - Rice University
 Principles of Physics: A Calculus-Based TextPhysicsISBN:9781133104261Author:Raymond A. Serway, John W. JewettPublisher:Cengage Learning