
Concept explainers
Videos
(a)
To Draw:
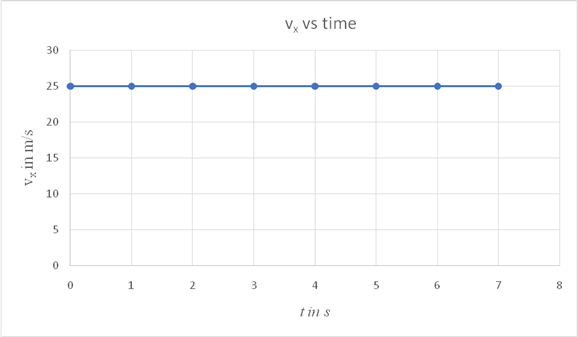
A graph of vx versus time for a projectile and identify the points where the object reaches its highest point and where it hits the ground at the end of its flight.
Explanation of Solution
Introduction:
Consider an object that undergoes a projectile motion. The object is projected with a velocity v at an angle θ to the horizontal. The velocity has an initial horizontal component
For the purpose of drawing a graph showing the variation of vx with time, assume the value of
On a spread sheet insert the values as shown and draw a graph as shown.
| t in s | vx in m/s |
| 0 | 25 |
| 1 | 25 |
| 2 | 25 |
| 3 | 25 |
| 4 | 25 |
| 5 | 25 |
| 6 | 25 |
| 7 | 25 |
Conclusion:
The graph is a straight line parallel to the time axis. From the above graph, it is not possible to identify the points where the object reaches its maximum height or when it reaches the ground, since the graph shows no variation of the horizontal component with time.
(b)
To Draw:
A graph of vy versus time for a projectile and identify the points where the object reaches its highest point and where it hits the ground at the end of its flight.
Explanation of Solution
Introduction:
Consider an object that undergoes a projectile motion. The object is projected with a velocity v at an angle θ to the horizontal. The velocity has an initial horizontal component
The projectile after it is launched is under the action of the acceleration of free fall. The vertical component of the projectile varies under the action of the acceleration due to gravity g.
The expression which shows the variation of vy with time is given by,
The acceleration due to gravity g is directed downwards, opposite to the direction of the vertical component of the velocity at the moment of launch. Therefore, it is given a value
Assume, the value of
On a spreadsheet, use the following equation to plot the variation of vy with time.
| t in s | vy in m/s |
| 0 | 30 |
| 0.1 | 29.019 |
| 0.2 | 28.038 |
| 0.3 | 27.057 |
| 0.4 | 26.076 |
| 0.5 | 25.095 |
| 0.6 | 24.114 |
| 0.7 | 23.133 |
| 0.8 | 22.152 |
| 0.9 | 21.171 |
| 1 | 20.19 |
| 1.1 | 19.209 |
| 1.2 | 18.228 |
| 1.3 | 17.247 |
| 1.4 | 16.266 |
| 1.5 | 15.285 |
| 1.6 | 14.304 |
| 1.7 | 13.323 |
| 1.8 | 12.342 |
| 1.9 | 11.361 |
| 2 | 10.38 |
| 2.1 | 9.399 |
| 2.2 | 8.418 |
| 2.3 | 7.437 |
| 2.4 | 6.456 |
| 2.5 | 5.475 |
| 2.6 | 4.494 |
| 2.7 | 3.513 |
| 2.8 | 2.532 |
| 2.9 | 1.551 |
| 3 | 0.57 |
| 3.1 | -0.411 |
| 3.2 | -1.392 |
| 3.3 | -2.373 |
| 3.4 | -3.354 |
| 3.5 | -4.335 |
| 3.6 | -5.316 |
| 3.7 | -6.297 |
| 3.8 | -7.278 |
| 3.9 | -8.259 |
| 4 | -9.24 |
| 4.1 | -10.221 |
| 4.2 | -11.202 |
| 4.3 | -12.183 |
| 4.4 | -13.164 |
| 4.5 | -14.145 |
| 4.6 | -15.126 |
| 4.7 | -16.107 |
| 4.8 | -17.088 |
| 4.9 | -18.069 |
| 5 | -19.05 |
| 5.1 | -20.031 |
| 5.2 | -21.012 |
| 5.3 | -21.993 |
| 5.4 | -22.974 |
| 5.5 | -23.955 |
| 5.6 | -24.936 |
| 5.7 | -25.917 |
| 5.8 | -26.898 |
| 5.9 | -27.879 |
| 6 | -28.86 |
| 6.1 | -29.841 |
| 6.2 | -30.822 |
From the graph, the following points are noted:
1.The maximum positive value of vy is at point O, which the point at which it is launched.
2. As the object rises, the vertical component of its velocity reduces under the action of acceleration due to gravity g. When it reaches the maximum height, this component attains a value zero. This is seen from the graph as point A. The time taken by this projectile to reach its maximum height is seen to be equal to 3.05 s.
3. As the object descends from the position of maximum height, the vertical component of its velocity is directed downwards and hence it has a negative value. Its value increases as it moves downwards, since now, the vertical component vy and the acceleration due to gravity are both directed downwards. When it hits the ground, the vertical component vy has a magnitude of 30 m/s and it is directed downwards, hence negative. Point B represents the point when it reaches the ground. The total time of flight from the graph is 6.1 s.
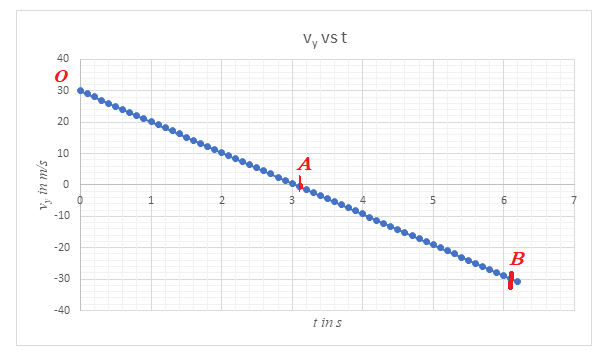
Conclusion:
The object with a vertical component of magnitude 30 m/s, reaches the position of maximum height in time 3.05 s and reaches the ground after 6.1 s. The graph varies linearly with time. The gradient of the graph is equal to g which has a value
(c)
To Draw:
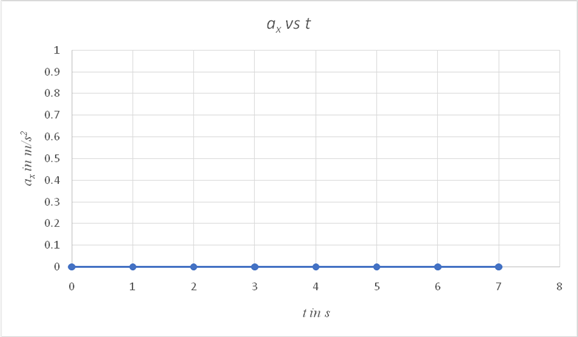
A graph showing the variation of ax with time.
Explanation of Solution
Introduction:
A projectile travels a parabolic path under the action of acceleration due to gravity, if no air resistance acts on it.
The only force acting on the projectile is the gravitational force, which is directed downwards, towards the center of the Earth. This force is constant at points close to the surface of the earth. Since it is directed towards the ground, it has no component along the horizontal direction. Hence,
On a spreadsheet, use
| tin s | ax in m/s2 |
| 0 | 0 |
| 1 | 0 |
| 2 | 0 |
| 3 | 0 |
| 4 | 0 |
| 5 | 0 |
| 6 | 0 |
| 7 | 0 |
Conclusion:
Since the only force acting on the projectile is the gravitational force and it has no component along the horizontal direction, the horizontal component of its acceleration is zero at all times, as shown in the graph.
(d)
To Draw:
A graph showing the variation of ay with time.
Explanation of Solution
Introduction:
A projectile travel in a parabolic path under the action of acceleration due to gravity. If no air resistance acts on the object, the only force acting on it is the gravitational force. Hence the vertical component of the object's acceleration is
The gravitational force is a constant at points close to the surface of the earth. The acceleration due to gravity has a constant value of
On a spreadsheet, use the expression
| tin s | ay in m/s2 |
| 0 | -9.81 |
| 1 | -9.81 |
| 2 | -9.81 |
| 3 | -9.81 |
| 4 | -9.81 |
| 5 | -9.81 |
| 6 | -9.81 |
| 7 | -9.81 |
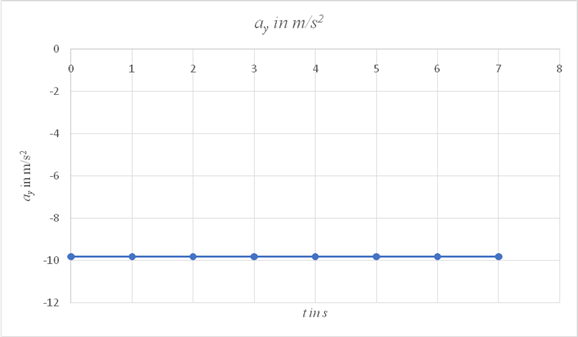
Conclusion:
The graph of ay vs time is a straight line parallel to the time axis and has a constant value of
Want to see more full solutions like this?
Chapter 3 Solutions
FlipIt for College Physics (Algebra Version - Six Months Access)


- Three identical capacitors are connected in parallel. When this parallel assembly of capacitors is connected to a 12 volt battery, a total of 3.1 x 10⁻⁵ coulombs flows through the battery. What is the capacitance of one individual capacitor? (Give your answer as the number of Farads.)arrow_forwardSuppose you construct your own capacitor by placing two parallel plates at a distance 0.27 meters apart. The plates each have a surface area of 0.64 square meters. What is the capacitance of this setup? (Give your answer as the number of Farads.)arrow_forwardDraw a diagram with the new arrows. No they do not point all towards the center.arrow_forward
- Example In Canada, the Earth has B = 0.5 mŢ, pointing north, 70.0° below the horizontal. a) Find the magnetic force on an oxygen ion (O2) moving due east at 250 m/s b) Compare the |FB| to |FE| due to Earth's fair- weather electric field (150 V/m downward).arrow_forwardFour charges, qa, qb, qa, and qd are fixed at the corners of a square. A charge q that is free to move located at the exact center of the square. Classify the scenarios described according to the force that would be exerted on the center charge q. Assume in each case that q is a positive charge. Do not assume that the fixed charges have equal magnitudes unless the scenario defines such an equality. qa Яс q %b Force is zero Force is to the left Force is to the right Force is undeterminedarrow_forwardCharge qi = -q is located at position (0, d). Charge q = −2q₁ is located at position (d,0). Charge q3 = located at position (2d, 2d). 5qi is y Determine the net electric field Ĕ net at the origin. Enter your expression using ij unit vector notation in terms of the given quantities, the permittivity of free space €0, and exact rational and irrational numbers. d 9₁ d TH net = 92 d d Xarrow_forward
- solve pleasearrow_forward= = R4 R5 = 12.5 Q. A - In the circuit shown, R₁ = R₂ = R 3 voltmeter measures the potential difference across the battery. When the switch is in position 1, the voltmeter measures V₁ = 13.8 V. When the switch is in position 2, the voltmeter measures V2 = 13.4 V. What is the emf ☐ of the battery? 14.93 = What is the battery's internal resistance r? r = V CH Ω R₁₂ V S R₁ 02 2 R₁ 4 R3 R 5arrow_forwardConsider the arrangement of charges shown in the figure. Four charges of equal magnitude Q but varying sign are placed at the corners of a square as indicated. A positive charge q is placed in the center. What is the direction of the net force, if any, on the center charge? Indicate your answer by placing the appropriate label in the first box. Then, suppose that the charge q were to be displaced slightly from the center position. On the figure, label each box with the arrow that best indicates the direction of the net force that would act on q if it were moved to that location. Net Force Answer Bank no force ↑ +2 0 -Q -Q +Qarrow_forward
- Don't use ai to answer I will report you answerarrow_forwardWhen an electromagnetic wave is reflected at normal incidence on a perfectly conducting surface, the electric fieldvector of the reflected wave at the reflecting surface is the negative of that of the incident wave.a) Explain why this should be so.b) Show that the superposition of the incident and reflected waves results in a standing wave.c) What is the relationship between the magnetic field vector of the incident and reflected waves at the reflectingsurface?arrow_forwardSuppose there are two transformers between your house and the high-voltage transmission line that distributes the power. In addition, assume your house is the only one using electric power. At a substation the primary of a step-down transformer (turns ratio = 1:23) receives the voltage from the high-voltage transmission line. Because of your usage, a current of 51.1 mA exists in the primary of the transformer. The secondary is connected to the primary of another step- down transformer (turns ratio = 1:36) somewhere near your house, perhaps up on a telephone pole. The secondary of this transformer delivers a 240-V emf to your house. How much power is your house using? Remember that the current and voltage given in this problem are rms values.arrow_forward
 Glencoe Physics: Principles and Problems, Student...PhysicsISBN:9780078807213Author:Paul W. ZitzewitzPublisher:Glencoe/McGraw-Hill
 An Introduction to Physical SciencePhysicsISBN:9781305079137Author:James Shipman, Jerry D. Wilson, Charles A. Higgins, Omar TorresPublisher:Cengage Learning
 College PhysicsPhysicsISBN:9781305952300Author:Raymond A. Serway, Chris VuillePublisher:Cengage Learning
 College PhysicsPhysicsISBN:9781285737027Author:Raymond A. Serway, Chris VuillePublisher:Cengage Learning
 University Physics Volume 1PhysicsISBN:9781938168277Author:William Moebs, Samuel J. Ling, Jeff SannyPublisher:OpenStax - Rice University
 Principles of Physics: A Calculus-Based TextPhysicsISBN:9781133104261Author:Raymond A. Serway, John W. JewettPublisher:Cengage Learning