
Concept explainers
Videos
In addition to the key words, you should also be able to define each of the following terms:
| Positive relationship | ratio scale |
| Negative relationship | self-report measure |
| Accuracy | physiological measure |
| Scale of measurement | behavioral measure |
| Nominal scale | |
| Ordinal scale | artifact |
| Interval scale | subject roles or subject role behaviors |
The definition of the following terms.
Explanation of Solution
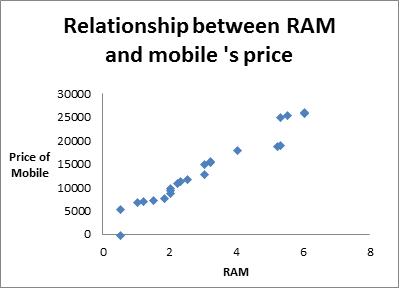
Positive Relationship:
In statistics, a positive relationship or positive correlation is defined as the relationship between two variables in which, increment (decrement) in one variable results in increment(decrement) of another variable (not necessarily in same ratio). In other words, positive relationship is the relationship between the two variables in which both variable moves in same direction.
For example, increment in RAM results in increment in price of mobile. The positive relationship can also be seen graphically through scatter plot.
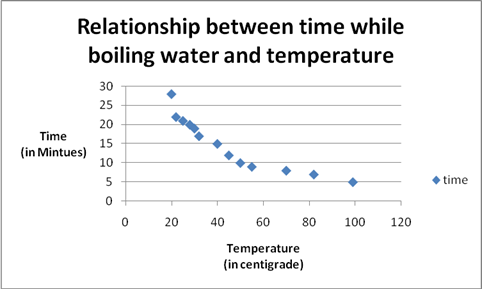
Negative Relationship:
In statistical terms, a negative relationship or negative correlation is defined as the relationship between two variables in which both the variables move in opposite direction, that is, increment(decrement) in the value of one variable results in decrement (increment) of other.
For example, on increasing the temperature of microwave, the time taken by water to boil is decreased.
Accuracy:
Statistics is not about deterministic value, it's about estimated value which is close to accurate value. While doing an experiment, one can never get exact value. So accuracy tells the closeness between true value and estimated value.
For example, a sample is drawn from a population having mean 30 and the sample mean is 29 then one can say that sample mean is accurate to within 1 unit.
Scale of Measurement:
The term 'measurement' is used in our daily lives very broadly but in statistics, the term 'scale of measurement' is used which is more appropriate and is used to categorize the variables. The scale of measurement gives some ways to categorize the variables. The scale of measurement is divided into four scales- nominal, ordinal, interval and ratio scale. Each scale has its own properties on the basis of which the variables can be categorized. This categorization is very useful while performing statistical analysis and without this categorization, it is not possible to perform analysis. The scale of measurement works as base of statistical analysis.
Nominal Scale:
The scale which consists of variables having categories and do not have any order is known as nominal scales and the variables are known as nominal or categorical variables. These variables are simply used as identifiers such as blood group (AB, A, B, O), gender (male and female), residential area (urban and rural) etc.
In this, categories of any variables can be assigned the codes in the form of the numbers and those numbers work as the labels. For a variable gender, male can be assigned as 0 and females as 1.
Ordinal Scale:
The ordinal scale contains the variables having categories and should be placed in order and the variables are known as ordinal variables. For example, ranks achieved in drawing competition, that is, first, second and third positions.
This scale is not used to represent the quantity.
Interval Scale:
The term 'interval' means 'gap in between' which shows the importance about each value between items. An interval scale is a scale in which zero point is arbitrary. In this scale, scores can be added and subtracted but cannot be multiplied meaningfully. For example, temperature because there is no such thing as 'no temperature'.
Ratio Scale:
The scale, consisting of the variable having true zero point is known as the ratio scale. In ratio scale, the percentage is useful unit. For example, weight is expressed in kilograms and also in grams and they are linearly related as 1kg=1000gms. Here 0 kilograms and 0 gram is same and would have no weight.
Self-Report Measure:
In self-report measure, we do a study based on questionnaire or survey. Here, respondents select their responses themselves and questions are based on their feelings, attitudes, behaviour etc. and record their answers.
Self report measures are operational definitions in which respondents are asked to fill the questionnaire about their own behaviour or mental conditions.
Psychological Measurement:
Psychological measurement deals with the measurement of psychological traits or mental abilities like intelligence, aptitude, interest, opinion, honesty or attitude. Psychological characteristics can be measured only with some degree of unreliability. The psychological scale is an interval scale because there is no absolute zero-point on the scale.
Behavioural Measure:
Behavioural measures are tests and methods, targets on information from a subject of interest. It contain over actions and reactions of respondents.
Range Effect:
When each subject of interest receives more than one experimental condition then range effect occurs. The range effects are critical to measurement of almost any kind of human behaviour.
Artefact:
In econometrics, artefact is defined as an error which occurs during data manipulation or in the case of selection of faulty choice of variables.
Subject role or subject role behaviours:
It includes the study of human thoughts and actions, individually as well as collectively. In this, the behaviour and reactions of human are recorded for any particular situation.
Want to see more full solutions like this?
Chapter 3 Solutions
Research Methods for the Behavioral Sciences


- Clint, obviously not in college, sleeps an average of 8 hours per night with a standard deviation of 15 minutes. What's the chance of him sleeping between 7.5 and 8.5 hours on any given night? 0-(7-0) 200 91109s and doiw $20 (8-0) mol 8520 slang $199 galbrog seam side pide & D (newid se od poyesvig as PELEO PER AFTE editiw noudab temand van Czarrow_forwardTimes to complete a statistics exam have a normal distribution with a mean of 40 minutes and standard deviation of 6 minutes. Deshawn's time comes in at the 90th percentile. What percentage of the students are still working on their exams when Deshawn leaves?arrow_forwardSuppose that the weights of cereal boxes have a normal distribution with a mean of 20 ounces and standard deviation of half an ounce. A box that has a standard score of o weighs how much? syed by ilog ni 21arrow_forward
- Bob scores 80 on both his math exam (which has a mean of 70 and standard deviation of 10) and his English exam (which has a mean of 85 and standard deviation of 5). Find and interpret Bob's Z-scores on both exams to let him know which exam (if either) he did bet- ter on. Don't, however, let his parents know; let them think he's just as good at both subjects. algas 70) sering digarrow_forwardSue's math class exam has a mean of 70 with a standard deviation of 5. Her standard score is-2. What's her original exam score?arrow_forwardClint sleeps an average of 8 hours per night with a standard deviation of 15 minutes. What's the chance he will sleep less than 7.5 hours tonight? nut bow visarrow_forward
- Suppose that your score on an exam is directly at the mean. What's your standard score?arrow_forwardOne state's annual rainfall has a normal dis- tribution with a mean of 100 inches and standard deviation of 25 inches. Suppose that corn grows best when the annual rainfall is between 100 and 150 inches. What's the chance of achieving this amount of rainfall? wved now of sociarrow_forward13 Suppose that your exam score has a standard score of 0.90. Does this mean that 90 percent of the other exam scores are lower than yours?arrow_forward
- Bob's commuting times to work have a nor- mal distribution with a mean of 45 minutes and standard deviation of 10 minutes. How often does Bob get to work in 30 to 45 minutes?arrow_forwardBob's commuting times to work have a nor- mal distribution with a mean of 45 minutes and standard deviation of 10 minutes. a. What percentage of the time does Bob get to work in 30 minutes or less? b. Bob's workday starts at 9 a.m. If he leaves at 8 a.m., how often is he late?arrow_forwardSuppose that you want to put fat Fido on a weight-loss program. Before the program, his weight had a standard score of +2 com- pared to dogs of his breed/age, and after the program, his weight has a standard score of -2. His weight before the program was 150 pounds, and the standard deviation for the breed is 5 pounds. a. What's the mean weight for Fido's breed/ age? b. What's his weight after the weight-loss program?arrow_forward
 Glencoe Algebra 1, Student Edition, 9780079039897...AlgebraISBN:9780079039897Author:CarterPublisher:McGraw Hill
 Holt Mcdougal Larson Pre-algebra: Student Edition...AlgebraISBN:9780547587776Author:HOLT MCDOUGALPublisher:HOLT MCDOUGAL
 Big Ideas Math A Bridge To Success Algebra 1: Stu...AlgebraISBN:9781680331141Author:HOUGHTON MIFFLIN HARCOURTPublisher:Houghton Mifflin Harcourt
 Linear Algebra: A Modern IntroductionAlgebraISBN:9781285463247Author:David PoolePublisher:Cengage Learning
 Functions and Change: A Modeling Approach to Coll...AlgebraISBN:9781337111348Author:Bruce Crauder, Benny Evans, Alan NoellPublisher:Cengage Learning