
Concept explainers
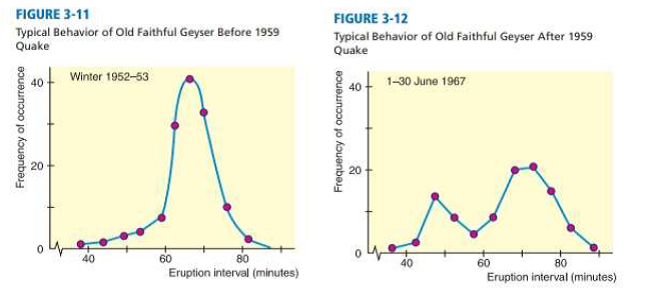
The Story of Old Faithful is a short book written by George MArler and published by the Yellowstone Association. Chapter 7 of this interesting book talks about the effect of the 1959 earthquake on eruption intervals for Old Faithful Geyser. Dr. John Rinehart (a senior research scientist with the National Oceanic and Atmospheric Administration) has done extensive studies of the eruption intervals before and after the 1959 earthquake. Examine Figure 3-11. Notice the general shape. Is the graph more or less symmetric? Does it have a single
Trending nowThis is a popular solution!
Chapter 3 Solutions
Understanding Basic Statistics
- Velocity of a Ferris Wheel Use Figure 7 as a model of the Ferris wheel called Colossus that is built in St. Louis in 1986. The diameter of the wheel is 165 feet. A brochure that gives some statistics associated with Colossus indicates that it rotates at 1.5 revolutions per minute and also indicates that a rider on the wheel is traveling at 10 miles per hour. Explain why these two numbers, 1.5 revolutions per minute and 10 miles per hour, cannot both be correct.arrow_forwardRefer to Figure 29-9 to determine the values in the table. Allowance is equal to the maximum interference. All dimensions are in millimetersarrow_forwardSuppose that the peak of the roof occurs 20 rather than 14 horizontal feet toward the interior of the structure. How high would the peak of the roof be in this setting? Example 3.1 In Figure 3.5, we have extended the roof to its peak 14 horizontal feet toward the interior of the structure. FIGURE 3.5 Extending the roof line to its peakarrow_forward
- The tables for Exercises 15 and 16 give the position of the zero graduation on the vernier scale in reference to the main scale and the vernier scale graduation that coincides with a main scale graduation. Determine the vernier caliper settings. The answer to the first part of Exercise 15 is givenarrow_forwardA researcher studies water clarity at the same location in a lake on the same dates during the course of a year and repeats the measurements on the same dates 5 years later. The researcher immerses a weighted disk painted black and white and measures the depth (in inches) at which it is no longer visible. The collected data is given in the table below. Complete parts (a) through (c) below. Observation 1 2 3 4 5 6 3/19 5/30 7/3 9/13 1/25 41.6 72.7 72.4 65.9 49.3 72.1 11/7 64.2 68.6 76.6 69.4 69.8 70.5 Date Initial Depth, X₁ Depth Five Years Later, Y; B. Using the same dates maximizes the difference in water clarity. C. Those are the same dates that all biologists use to take water clarity samples. D. Using the same dates makes the second sample dependent on the first and reduces variability in water clarity attributable to date. b) Does the evidence suggest that the clarity of the lake is improving at the α = 0.05 level of significance? Note that the normal probability plot and boxplot…arrow_forwardA researcher studies water clarity at the same location in a lake on the same dates during the course of a year and repeats the measurements on the same dates 5 years later. The researcher immerses a weighted disk painted black and white and measures the dep it is no longer visible. The collected data is given in the table below. Complete parts (a) through (c) below. Observation 1 2 3 4 5 6. Date 1/25 3/19 5/30 7/3 9/13 11/7 Initial Depth, X; 46.7 63.4 45.1 44.4 56.6 70.8 Depth Five Years Later, Y; 55.3 61.2 47.6 42.8 62.7 68.4 Click the icon to view the table of critical t-values. a) Why is it important to take the measurements on the same date?arrow_forward
- A researcher studies water clarity at the same location in a lake on the same dates during the course of a year and repeats the measurements on the same dates 5 years later. The researcher immerses a weighted disk painted black and white and measures the depth (in inches) at which it is no longer visible. The collected data is given in the table below. Complete parts (a) through (c) below. Observation 1 2 3 4 5 6 1/25 3/19 5/30 7/3 9/13 11/7 71.2 35.6 53.8 41.2 57.3 43.4 72.1 35.1 59.0 41.0 61.0 47.0 Date Initial Depth, X, Depth Five Years Later, Y, Click the icon to view the table of critical t-values. (a) Why is it important to take the measurements on the same date? OA. Using the same dates makes it easier to remember to take samples. B. Those are the same dates that all biologists use to take water clarity samples. C. Using the same dates makes the second sample dependent on the first and reduces variability in water clarity attributable to date. D. Using the same dates maximizes…arrow_forwardA researcher studies water clarity at the same location in a lake on the same dates during the course of a year and repeats the measurements on the same dates 5 years later. The researcher immerses a weighted disk painted black and white and measures the depth (in inches) at which it is no longer visible. The collected data is given in the table below. Complete parts (a) through (c) below. Observation 1 2 3 4 5 6 1/25 3/19 5/30 7/3 9/13 11/7 41.6 72.7 72.4 65.9 64.2 68.6 49.3 72.1 76.6 69.4 69.8 70.5 Date Initial Depth, X¡ Depth Five Years Later, Y; What is your conclusion regarding Ho? A. Do not reject Ho. There is not sufficient evidence at the α = 0.05 level of significance to conclude that the clarity of the lake is improving. B. Do not reject Ho. There is sufficient evidence at the x = 0.05 level of significance to conclude that the clarity of the lake is improving. C. Reject Ho. There is sufficient evidence at the x = 0.05 level of significance to conclude that the clarity of the…arrow_forwardA researcher studies water clarity at the same location in a lake on the same dates during the course of a year and repeats the measurements on the same dates 5 years later. The researcher immerses a weighted disk painted black and white and measures the depth (in inches) at which it is no longer visible. The collected data is given in the table below. Complete parts (a) through (c) below. Observation 1 2 3 4 5 6 1/25 3/19 5/30 713 9/13 11/7 37.2 47.1 55.5 49.3 67.3 68.1 44.0 46.6 59.9 51.4 73.5 70.2 Date Initial Depth, X₁ Depth Five Years Later, Y; a) Why is it important to take the measurements on the same date? ▶ OA. Using the same dates makes it easier to remember to take samples. OB. Using the same dates makes the second sample dependent on the first and reduces variability in water clarity attributable to date. OC. Those are the same dates that all biologists use to take water clarity samples. OD. Using the same dates maximizes the difference in water clarity. b) Does the…arrow_forward
- A researcher studies water clarity at the same location in a lake on the same dates during the course of a year and repeats the measurements on the same dates 5 years later. The researcher immerses a weighted disk painted black and white and measures the depth (in inches) at which it is no longer visible. The collected data is given in the table below. Complete parts (a) through (c) below. Observation 1 2 3 4 5 6 1/25 3/19 5/30 7/3 9/13 11/7 Date Initial Depth, X, Depth Five Years Later, Y, Click the icon to view the table of critical t-values. 4 71.2 35.6 53.8 41.2 57.3 43.4 72.1 35.1 59.0 41.0 61.0 47.0 (a) Why is it important to take the measurements on the same date? OA. Using the same dates makes it easier to remember to take samples. OB. Those are the same dates that all biologists use to take water clarity samples. OC. Using the same dates makes the second sample dependent on the first and reduces variability in water clarity attributable to date. OD. Using the same dates…arrow_forwardA researcher studies water clarity at the same location in a lake on the same dates during the course of a year and repeats the measurements on the same dates 5 years later. The researcher immerses a weighted disk painted black and white and measures the depth (in inches) at which it is no longer visible. The collected data is given in the table below. Complete parts (a) through (c) below. Observation 1 2 3 4 5 6 1/25 3/19 5/30 7/3 9/13 11/7 41.6 72.7 72.4 65.9 64.2 68.6 49.3 72.1 76.6 69.4 69.8 70.5 Date Initial Depth, X, Depth Five Years Later, Y, ... a) Why is it important to take the measurements on the same date? OA. Using the same dates makes it easier to remember to take samples. B. Using the same dates maximizes the difference in water clarity. OC. Those are the same dates that all biologists use to take water clarity samples. D. Using the same dates makes the second sample dependent on the first and reduces variability in water clarity attributable to date. b) Does the…arrow_forwardplot the graphs you are talking about on desmos and take a screenshotarrow_forward
- Algebra & Trigonometry with Analytic GeometryAlgebraISBN:9781133382119Author:SwokowskiPublisher:CengageTrigonometry (MindTap Course List)TrigonometryISBN:9781305652224Author:Charles P. McKeague, Mark D. TurnerPublisher:Cengage LearningMathematics For Machine TechnologyAdvanced MathISBN:9781337798310Author:Peterson, John.Publisher:Cengage Learning,
- Functions and Change: A Modeling Approach to Coll...AlgebraISBN:9781337111348Author:Bruce Crauder, Benny Evans, Alan NoellPublisher:Cengage LearningCollege Algebra (MindTap Course List)AlgebraISBN:9781305652231Author:R. David Gustafson, Jeff HughesPublisher:Cengage Learning