
Concept explainers
Videos
M&L MANUFACTURING
M&L Manufacturing makes various components for printers and copiers. In addition to supplying these items to a major manufacturer, the company distributes these and similar items to office supply stores and computer stores as replacement parts for printers and desktop copiers in all the company makes about 20 different items. The two markets (the major manufacturer and the replacement market) require somewhat different handling. For example replacement products must be packaged individually whereas products are shipped in bulk to the major manufacturer.
The company does not use forecasts for production planning. Instead, the operations manager decides which items to produce and the batch size based on orders and the amounts in inventory. The products that have the fewest amounts in inventory get the highest priority. Demand is uneven, and the company has experienced being overstocked on some items and out of others. Being understocked has occasionally created tensions with the managers of retail outlets. Another problem is that prices of raw materials have been creeping up, although the operations manager thinks that this might be a temporary condition.
Because of competitive pressures and falling profits the manager has decide to undertake a number of changes. One change is to introduce more formal
With that m mind the manager wants to begin forecasting for two products. These products are important for several reasons. First, they account for a disproportionately large share of the company’s profits. Second, the manager believes that one of these products will become increasingly important to future growth plans and third, the other product has experienced periodic out-of-stock instances.
The manager has compiled data on product demand for the two products from order records for the previous 14 weeks. These are shown in the following table.
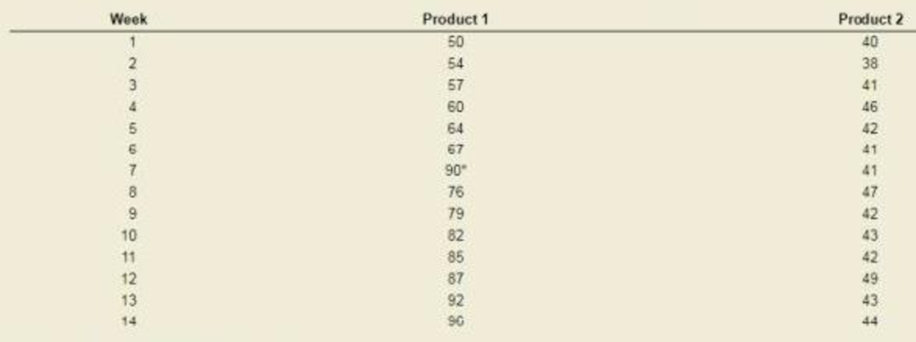
*Unusual order due to flooding of customer’s warehouse.
2. Prepare a weeldy forecast for the next four weeks each product. Briefly explain why you chose the method you used (Hint: For product 2, a simple approach, possibly some sort of naive/intuitive approach, would be preferable to a technical approach, would be preferable t a technical approach in view of the manager’s disdain of more technical methods.)
Want to see the full answer?
Check out a sample textbook solution
Chapter 3 Solutions
Operations Management


- The global marketplace has undergone a dramatic transformation, demanding that businesses adapt their supply chain management and implement new strategies to ensure the reliable sourcing of materials and goods. Please choose an organisation that you are currently working for or you are familiar with where its procurement operations has been greatly affected. You may pick a commercial or public institution as a choice for your study. You will need to briefly describe the institution and explain its category management structure which support the strategic procurement. You are required to provide an overview and discuss how spend are identified along with the types of categories purchased Briefly describe the organisation that you have chosen. Analyse the criticality of both the category management and strategic sourcing that will impact the business needs of the institution that you have chosen. Laing oxemples from the institution you have selected appraise and recommend COarrow_forwardThe Ideal Spot in the Segment Circles So, where should you try to position your product in the segment circles? As a basic rule, the 'Ideal Spot' will help guide you. The ideal spot represents the position with the highest point of demand for each consumer base – or segment. The ideal spot is made up by the product’s performance (speed) and size. As the perceptual map drifts down and to the right each year, the ideal spot will change as customers demand sensors with decreased size (smaller) and increased performance (faster). Although it would seem that the Ideal Spot would be in the center of the segment circle, the positioning actually varies due to the customer focus of each segment. For example, in the High End segment, the Ideal Spot is at the leading edge of the segment because those customers want the best possible product. Each segment’s ideal spot is represented by the pink dots on the Perceptual Map. Ideal Spots offset from segment center Calculating the Ideal Spot To…arrow_forwardIn Ecuador, cut roses are one of the country’s leading exports. Prior to advancements in the air transportation industry, this would have been impossible as roses must be sold within three to five days once cut. Today Ecuador is one of the world’s top producers of roses.arrow_forward
- The World Trade Organization is the only global trade organization and has 164 member nations representing 98 percent of world trade. How does the WTO help nations improve trade relations? What are some of the major challenges facing the WTO today?arrow_forwardWhat is a good example of a letter of recommendation for a 5th grade Language Arts Teaching Position at an elementary school from a school principal?arrow_forwardProblem 1 (10 Points) Davison Electronics manufactures three LED television monitors, identified as Model A, Model B, and Model C. Davison Electronics four manufacturing plants. Each model has its lowest possible production cost when produced at Plant 1. However, Plant 1 does not have the capacity to handle the total production of all three models. As a result, at least some of the production must be routed to the other manufacturing plants. The following table shows the minimum production requirements for next month, the plant capacities in units per month, and the production cost per unit at each plant: Model Production Cost per Unit Minimum Production Requirements Plant 1 Plant 2 Plant 3 Plant 4 A $25 $28 $37 $34 48,000 B $26 $35 $36 $41 75,000 C $20 $31 $26 $23 60,000 Production Capacity 65,000 50,000 32,000 43,000 Davison’s objective is to determine the cost-minimizing production plan. We have…arrow_forward
- Lead Story: Identify the key story or insight based on your visualizations. Shaffer’s 4C Framework: Describe how you applied Shaffer’s 4C principles in the design of your charts. Gestalt Principles or Preattentive Attributes: Explain how you applied at least one Gestalt principle or preattentive attribute in your chartarrow_forwardFor the purpose of process analysis, which of the following measures would be considered an appropriate flow unit for analyzing the main operation of a local accounting firm? Instructions: You may select more than one answer. a. Number of accountants working each week b. Number of tax returns completed each week c. Number of customers with past-due invoices d. Number of reams of paper received from suppliersarrow_forward4. Based on the data provided in Table 2.5, what is the flow rate of callers from 8:00 a.m. to 8:20 a.m.? TABLE 2.5 Time Stamps of the Eight Callers Who Called from 8:00 a.m. to 8:20 a.m. to the Reservation Desk of a Ferry Service Caller Time In Time Out 1 8:01 8:05 2 3 4 5 6 8:02 8:07 8:06 8:08 8:09 8:12 8:10 8:15 8:12 8:20 7 8:16 8:19 8 8:17 8:19 5. Based on the data provided in Table 2.5, what is the flow time of callers from 8:00 a.m. to 8:20 a.m.? 6. Based on the data provided in Table 2.6, what is the flow rate of customers from 9:00 a.m. to 10:00 a.m.? TABLE 2.6 Time Stamps of 10 Customers Who Visited a Local Bank Branch from 9:00 a.m. to 10:00 a.m. Customer 1 2 3 4 5 6 7 8 9 10 Time In Time Out 9:01 9:07 9:06 9:21 9:08 9:20 9:14 9:19 9:20 9:28 9:26 9:33 9:31 9:39 9:40 9:46 9:44 9:59 9:53 9:57 7. Based on the data provided in Table 2.6, what is the flow time of customers from 9:00 a.m. to 10:00 a.m.?arrow_forward
- How is Little’s Law currently used in today’s supply chains? Provide an example of where it is used.arrow_forwardHow would you Briefly state your views on music for a Christian school interview?arrow_forward3) Rane Brake Linings manufactures brake pads in a process focused facility; the fixed costs are nine thousand dollars per year, the variable cost is fifty dollars per brake pad, each brake pad sells for two hundred dollars. a) Calculate the breakeven point (in units) for this operation. b) Calculate the breakeven point (in $) for this operation. c) Calculate the profit/loss on a demand of two hundred brake pads per year. Note: You could work out the problem by hand or use excel; in chapter 5, section 5.11 of the Stevenson text, evaluating alternatives (cost volume analysis) is covered with examples; chapter 5 Stevenson lecture power point slides 34 to 44 (chapter 5 lecture: 29.49 mins to 38.87 mins) cover cost volume analysis with examples.arrow_forward
 Purchasing and Supply Chain ManagementOperations ManagementISBN:9781285869681Author:Robert M. Monczka, Robert B. Handfield, Larry C. Giunipero, James L. PattersonPublisher:Cengage Learning
 Practical Management ScienceOperations ManagementISBN:9781337406659Author:WINSTON, Wayne L.Publisher:Cengage,
- MarketingMarketingISBN:9780357033791Author:Pride, William MPublisher:South Western Educational Publishing
 Contemporary MarketingMarketingISBN:9780357033777Author:Louis E. Boone, David L. KurtzPublisher:Cengage Learning