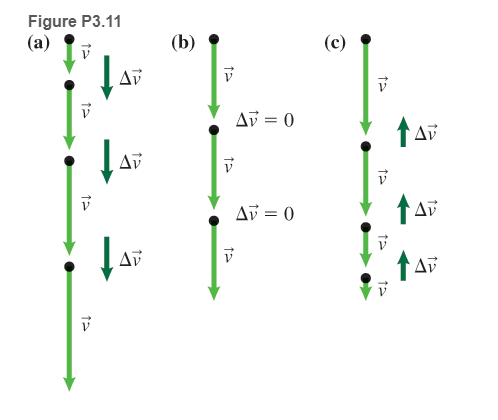
Three motion diagrams for a moving elevator are shown in Figure P3.11 . Construct two force diagrams (for two consecutive moments) for the elevator for each motion diagram. Be sure that the lengths of the force arrows are the appropriate relative lengths and that there is consistency between the force diagrams and the motion diagrams. What assumptions did you make?
Three motion diagrams for a moving elevator are shown in Figure P3.11 . Construct two force diagrams (for two consecutive moments) for the elevator for each motion diagram. Be sure that the lengths of the force arrows are the appropriate relative lengths and that there is consistency between the force diagrams and the motion diagrams. What assumptions did you make?
Three motion diagrams for a moving elevator are shown in Figure P3.11. Construct two force diagrams (for two consecutive moments) for the elevator for each motion diagram. Be sure that the lengths of the force arrows are the appropriate relative lengths and that there is consistency between the force diagrams and the motion diagrams. What assumptions did you make?
Will you please walk me through the calculations in more detail for solving this problem? I am a bit rusty on calculus and confused about the specific steps of the derivation: https://www.bartleby.com/solution-answer/chapter-3-problem-15e-modern-physics-2nd-edition/9780805303087/7cf8c31d-9476-46d5-a5a9-b897b16fe6fc
please help with the abstract. Abstract - This document outlines the format of the lab report and describes the Excel assignment. The abstract should be a short paragraph that very briefly includes the experiment objective, method, result and conclusion. After skimming the abstract, the reader should be able to decide whether they want to keep reading your work. Both the format of the report and the error analysis are to be followed. Note that abstract is not just the introduction and conclusion combined, but rather the whole experiment in short including the results. I have attacted the theory.
Using the Experimental Acceleration due to Gravity values from each data table, Data Tables 1, 2, and 3; determine the Standard Deviation, σ, mean, μ, variance, σ2 and the 95% Margin of Error (Confidence Level) Data: Ex. Acc. 1: 12.29 m/s^2. Ex. Acc. 2: 10.86 m/s^2, Ex. Acc. 3: 9.05 m/s^2
Chapter 3 Solutions
Modified Mastering Physics with Pearson eText -- Access Card -- for College Physics: Explore and Apply (18-Weeks)
College Physics: A Strategic Approach (3rd Edition)
Knowledge Booster
Learn more about
Need a deep-dive on the concept behind this application? Look no further. Learn more about this topic, physics and related others by exploring similar questions and additional content below.


 Physics for Scientists and Engineers: Foundations...PhysicsISBN:9781133939146Author:Katz, Debora M.Publisher:Cengage Learning
 Glencoe Physics: Principles and Problems, Student...PhysicsISBN:9780078807213Author:Paul W. ZitzewitzPublisher:Glencoe/McGraw-Hill
 University Physics Volume 1PhysicsISBN:9781938168277Author:William Moebs, Samuel J. Ling, Jeff SannyPublisher:OpenStax - Rice University
 College PhysicsPhysicsISBN:9781285737027Author:Raymond A. Serway, Chris VuillePublisher:Cengage Learning
 Principles of Physics: A Calculus-Based TextPhysicsISBN:9781133104261Author:Raymond A. Serway, John W. JewettPublisher:Cengage Learning
 Classical Dynamics of Particles and SystemsPhysicsISBN:9780534408961Author:Stephen T. Thornton, Jerry B. MarionPublisher:Cengage Learning