
a)
The question requires us to draw the demand and supply curve for labor and mark the equilibrium level of wage and quantity of the workers in the labor market.
a)
Explanation of Solution
In the labor market, Ls shows the supply curve, and Ld represents the demand curve for workers. Y-axis represents the wage workers are getting as compensation for their working hours, while the x-axis represents the number of workers at a particular wage. The intersection point of the supply and demand curve shows the equilibrium state in the market.
At equilibrium,
Labor demand = labor supply = L1 workers
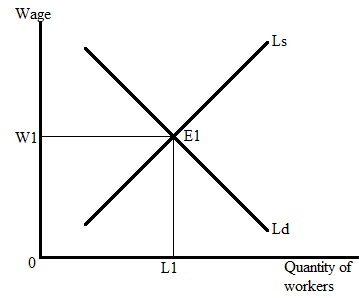
Here, E1 represents the equilibrium point where the supply curve and demand curve intersect each-other. The equilibrium number of workers is L1 and the equilibrium wage is W1.
The labor demand and supply curve represents the relationship between wage and quantity of workers in the labor market.
b)
The question requires us to determine the impact of advance technology on equilibrium wage and number of workers and mark the new equilibrium level of wage and quantity of the workers.
b)
Answer to Problem 2FRQ
The equilibrium wage and number of workers both will increase as the result of the advance technology which increases the productivity of the workers.
Explanation of Solution
The following graph represents the impact of higher productivity in the labor market:
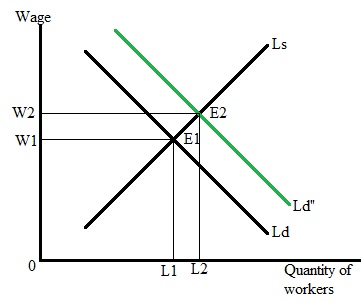
Here, E1 represents the initial equilibrium state in the labor market, where L1 is the equilibrium number of workers and W1 is the equilibrium wage.
Firms demand more workers when an advance technology improves the productivity of workers because by using this new technology and newly hired workers firms will be able to produce more products, and they can raise their profitability.
So, demand for workers rises in the market which causes the demand curve to shift rightward from Ld to Ld’’. E2 represents the new equilibrium point where W2 is the new equilibrium wage and L2 is the new equilibrium level of workers in the market.
c)
The question requires us to draw the effective minimum wage line in the labor market curves.
c)
Explanation of Solution
The government sets the effective minimum wage to protect the workers from exploitation or from working at the lower wage. To protect the interest of workers, the government sets the effective minimum wage above the equilibrium wage. Giving wages below the set minimum wage results in penalties or punishments.
The following graph represents the effective minimum wage line:
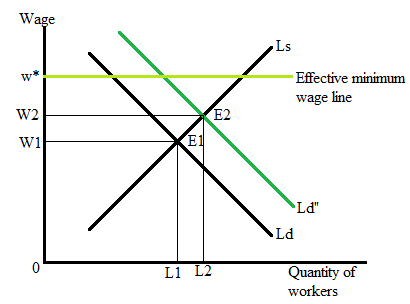
Here, the w* represents the effective minimum wage sets by the government and the colored line (light green line) shows the effective minimum wage line.
At w*, supply of workers will be higher and workers will get higher wage.
Chapter 2R Solutions
EBK KRUGMAN'S ECONOMICS F/AP COURSE

- not use ai pleasearrow_forward(d) Calculate the total change in qı. Total change: 007 (sp) S to vlijnsi (e) B₁ is our original budget constraint and B2 is our new budget constraint after the price of good 1 (p1) increased. Decompose the change in qı (that occurred from the increase in p₁) into the income and substitution effects. It is okay to estimate as needed via visual inspection. Add any necessary information to the graph to support your 03 answer. Substitution Effect: Income Effect:arrow_forwardeverything is in image (8 and 10) there are two images each separate questionsarrow_forward
- everything is in the picture (13) the first blank has the options (an equilibrium or a surplus) the second blank has the options (a surplus or a shortage)arrow_forwardeverything is in the photo (27) the first blank has options (The US, Mexico, Canada) the second blank has the options (The US, Mexico, Canada)arrow_forwardeverything is in photo (26)arrow_forward
- everything is in question (21)arrow_forwardeverything is in photo (19)arrow_forwardIn announcing tariffs on imported steel and aluminum last week, the President said he was imposing a tax on foreign manufacturers who seek to export to the U.S. Is that a fair description of what he did and who will pay? Explain your answer.arrow_forward

 Principles of Economics (12th Edition)EconomicsISBN:9780134078779Author:Karl E. Case, Ray C. Fair, Sharon E. OsterPublisher:PEARSON
 Engineering Economy (17th Edition)EconomicsISBN:9780134870069Author:William G. Sullivan, Elin M. Wicks, C. Patrick KoellingPublisher:PEARSON
 Principles of Economics (MindTap Course List)EconomicsISBN:9781305585126Author:N. Gregory MankiwPublisher:Cengage Learning
 Managerial Economics: A Problem Solving ApproachEconomicsISBN:9781337106665Author:Luke M. Froeb, Brian T. McCann, Michael R. Ward, Mike ShorPublisher:Cengage Learning
 Managerial Economics & Business Strategy (Mcgraw-...EconomicsISBN:9781259290619Author:Michael Baye, Jeff PrincePublisher:McGraw-Hill Education