
a)
The question requires us to draw the
a)
Explanation of Solution
In the market for paintings, S1 shows the vertical supply curve, and D1 is the demand curve for paintings. The supply curve is vertical because the number of paintings is fixed (Q = 1000 units). The intersection point of the supply and the demand curve shows the equilibrium state in the market.
At equilibrium,
Quantity supplied = Quantity demanded = 1000 units.
The following graph represents the market for paintings:
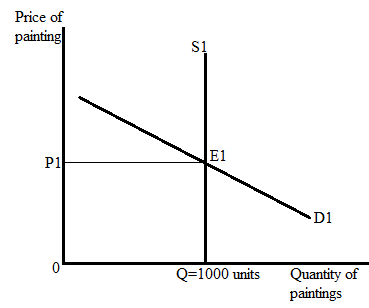
Here, E1 represents the equilibrium point where the supply curve and demand curve intersect each-other. The
The demand curve represents the relationship between the price and quantity demanded of a commodity while the supply curve represents the relationship between the price of a product and the quantity supplied at the given price.
The demand curve is a downward-sloping curve that represents the inverse relationship between the quantity demanded and the price of the product i.e., when the price of a product increases its quantity demanded falls and vice versa. On the other hand, the supply curve is a positive-slope curve that represents the positive relationship between the price of the product and the quantity supplied.
b)
The question requires us to list the five principal factors that impact the price of paintings in the market.
b)
Explanation of Solution
Any change in supply and demand of the paintings will cause the price of paintings to change. The five principal factors that can impact the price of paintings are the following:
- Price of relative products: when the price of similar paintings will fall then the demand and thus the price of Pablo’s paintings will fall as well because consumers will prefer less expensive products over expensive ones.
- Income of consumers: A higher income indicates higher demand for paintings and thus causes the price of paintings to rise.
- Taste and preferences of consumers: Due to some reason consumers start giving preference to Pablo’s paintings and start demanding more. Again a higher demand will cause the price to rise.
- Lack of logistic and market supports: Due to poor connectivity between buyers and suppliers, the price of paintings will change.
- The expectation of a higher price soon: When consumers expect a higher price for the painting soon, they demand more and a higher demand will hike the price level.
c)
The question requires us to determine the impact of high demand on the price of paintings.
c)
Explanation of Solution
The following graph represents the impact of high demand in the painting market:
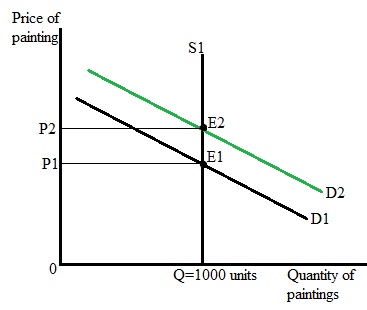
Here, E1 represents the initial equilibrium state in the painting market. At equilibrium Q represents the equilibrium quantity, and P1 represents the equilibrium price. When wealthy art collectors decide to buy the paintings, the demand for paintings will increase. A higher demand causes the demand curve to shift rightward from D1 to D2, and results in a higher price P2.
E2 represents the new equilibrium point, where P2 is the new market price for the paintings.
An increase in demand will only increase the price of paintings. There will be no impact on quantity because the supply of paintings is fixed.
Chapter 2R Solutions
EBK KRUGMAN'S ECONOMICS F/AP COURSE

- The figure below shows the hypothetical domestic supply and demand for baseball caps in the country of Spain. Domestic Supply and Demand for Baseball Caps Price (€ per cap) 10 9 8 7 6 5 4 3 2 1 0 Spain Dd 10 20 30 40 50 60 70 80 90 100 Baseball caps (thousands per month) Suppose that the world price of baseball caps is €2 and there are no import restrictions on this product. Assume that Spanish consumers are indifferent between domestic and imported baseball caps. Instructions: Enter your answers as whole numbers. a. What quantity of baseball caps will domestic suppliers supply to domestic consumers? thousand b. What quantity of baseball caps will be imported? thousand Now suppose a tariff of €1 is levied against each imported baseball cap. c. After the tariff is implemented, what quantity of baseball caps will domestic suppliers supply to domestic consumers? thousand d. After the tariff is implemented, what quantity of baseball caps will be imported? thousandarrow_forwardMay I please have the solutions for the following assignment? as 2025arrow_forwardResponse to J.C. Ethics Statement Raising our products' global profile requires a firm commitment to doing the right thing by society and the environment. By switching to a more energy-efficient cloud architecture, BillRight Software, Inc. will reduce its carbon footprint while also ensuring the absolute security of all customer data. Fair labor standards, a diverse and inclusive workforce, and giving back to the communities where our employees live and work are some of our core values. Following local regulations, accepting cultural variances, and actively participating in community development projects are all ways our brand and product will uphold our ethical values globally (Corcoran, 2024; Kotler et al., 2023; Kotler & Keller, 2024; Solomon & Russell, 2024). How MKTG 525 Gets You Together with Classmates? Different points of view in dealing with classmates from many backgrounds exposes you to many points of view, ideas, and techniques. This variety enriches the learning…arrow_forward
- 3. Case 2) Coal plants exit, and Solar generation enters the market Now, let's consider a scenario where the coal power plant (#1) shuts down and exits the market, and a solar generation facility is constructed. The capacity of the solar generation facility is the same as the coal power plant that went out of business. The generation capacities of this market are shown below, along with their MC. Table 3: Power Plant Capacity and Marginal Cost: Case 2 Plant # Energy Source Capacity (MW) MC (S/MWh) 2 Oil 100 90 3 Natural Gas 500 50 4 Nuclear 600 0 5 Solar 300 5 Note that the solar plant (#5) can generate electricity only from 7 AM until 5PM. During these hours, the plant can generate up to its full capacity (300 MW) but cannot generate any when unavailable. (a) Draw a supply curve for each hourly market (4AM, 10 AM, 2PM, 6PM). (b) Find the market clearing prices and calculate how much electricity each power plant generates in the hourly market (4AM, 10AM, 2PM, and 6PM). (c) Find the…arrow_forwardRespond to L.R. To analyze consumer spending, you must review the macroeconomic indicators of Personal Consumption Expenditures (PCE) and Retail Sales over the past year. Selected Macroeconomic indicators Personal Consumption Expenditures (PCE) measure the value of household goods and services consumed and are a key indicator of consumer spending. - Retail Sales: This tracks the total receipts of retail stores and provides insight into consumer demand and spending trends. - Patterns over the past year: Personal Consumption Expenditures (PCE) Over the past year, PCE has steadily increased, reflecting consumer confidence and willingness to spend. The growth rate has been moderate, driven by wage growth, low unemployment rates, and government stimulus measures. However, inflationary pressures have also impacted real purchasing power, leading to a mixed outlook. - Retail sales have also experienced fluctuations but have generally trended upwards. After a…arrow_forward4. Case 3) Electricity demand increases due to increased EV adoption We will continue using the Case 2 supply curve (with the solar plant in operation) for this analysis. Suppose that electricity consumption from electric vehicles (EV) increases significantly. Consequently, electricity demand in the wholesale market increases at every hour. The new demand levels are shown in Table 5 below. The market operator has backup power plants (using natural gas) ready, with a total capacity of 300 MW and a MC of $100/MWh. Table 5: Hourly Demand (selected hours) Hour Demand (MWh) 4 AM 800 10 AM 1000 ... 2 PM 1100 ... 6 PM 1300 (a) Find the market clearing prices and calculate how much electricity each power plant generates in the hourly market (4AM, 10AM, 2PM, and 6PM). Is there a specific hourly market in which the market operator will need to dispatch backup generation? (b) Compare the Case 2 scenario with the Case 3 scenario in terms of CO2 emissions and average electricity price. Based on…arrow_forward
- 2. Case 1) NG price decreases Now, suppose that the price of natural gas decreased substantially, causing the marginal cost of the NG power plant to decrease to MC = $35/MWh. The demand is the same as in Case 0. (a) Draw a new supply curve that reflects the MC change of the NG power plant. (b) Find the market clearing prices and calculate how much electricity each power plant generates in the hourly market (4AM, 10AM, 2PM, and 6PM). (c) What happened to the coal power plant? (d) Do you think the market outcomes (like average price) and the total CO2 emissions have improved under this Case 1 scenario (use the emissions data provided in the lecture slides)?arrow_forward1. Case 0) Baseline case Table 1: Power Plant Capacity and Marginal Cost: Case 0 Plant # Energy Source Capacity (MW) MC (S/MWh) 1 Coal 300 45 2 Oil 100 90 3 4 Natural Gas Nuclear 500 50 600 0 (a) Calculate the capacity mix of this market by energy source. (b) Draw a supply curve of this wholesale generation market. Table 2 below shows the demand levels for selected hours of a representative day. We will consider only these four hourly markets for our analysis. Note that the 6 PM demand is the highest demand level of the day. Table 2: Hourly Demand (selected hours) Hour Demand (MWh) 4 AM 500 10 AM 700 2 PM 800 6 PM 1000 (c) Find the market clearing prices and calculate how much electricity each power plant generates in the hourly market (4AM, 10AM, 2PM, and 6PM). (d) Find the average price of electricity (by taking a simple average of hourly prices; [P(4am) + P(10AM) + P(2PM) + P(6PM)]/4).arrow_forwardDon't used Ai solutionarrow_forward
- How human recource allocated in an economic?arrow_forwardRespond to B.A. I have chosen Gross Domestic Product (GDP) as the macroeconomic indicator to review and provide a forecast prediction. Based on the current trend I predict a 2% annual GDP growth rate, indicating an unstable economy due to the impact of Donald Trump's tariffs on some countries and other other economic factors. This growth rate is lower than the historical average , indicating a slowdown in economic expansion. Overall, the forecast suggests a modest growth in GDP, but with potential risks and uncertainties ahead. But if he reverse his tariff policies, I think it could possibly result in a strong economic growth. As the removal of tariffs would likely minimize the costs for businesses and consumers and also rise trade and economic activities. Provide feedback/comments this post. You could agreement or disagreement (including why you agree or disagree). Or you could expand on this post by sharing different views and predictions.arrow_forwardCan you show me how to solve this.arrow_forward

 Principles of Economics (12th Edition)EconomicsISBN:9780134078779Author:Karl E. Case, Ray C. Fair, Sharon E. OsterPublisher:PEARSON
 Engineering Economy (17th Edition)EconomicsISBN:9780134870069Author:William G. Sullivan, Elin M. Wicks, C. Patrick KoellingPublisher:PEARSON
 Principles of Economics (MindTap Course List)EconomicsISBN:9781305585126Author:N. Gregory MankiwPublisher:Cengage Learning
 Managerial Economics: A Problem Solving ApproachEconomicsISBN:9781337106665Author:Luke M. Froeb, Brian T. McCann, Michael R. Ward, Mike ShorPublisher:Cengage Learning
 Managerial Economics & Business Strategy (Mcgraw-...EconomicsISBN:9781259290619Author:Michael Baye, Jeff PrincePublisher:McGraw-Hill Education