
a.
To Describe: The domain for the given situation.
The domain for the given situation is
Given information:
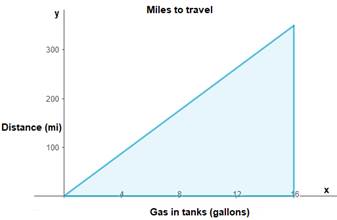
The graph relates the amount of gas in the tank of the car to the distance the car can drive.
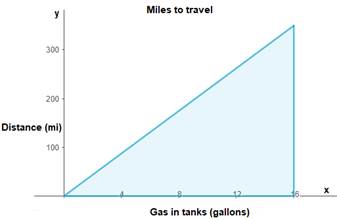
Explanation:
Given the graph is,
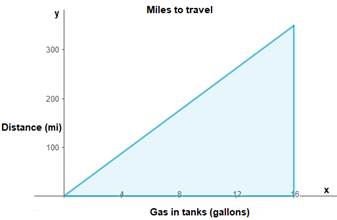
From the graph, due to the solid line, not being dashed, we include
A domain is a set of possible input values. Graphs have domains consisting of all input values shown on the
So, in
Interval notation represents a set of values using brackets for included values and parentheses for non-included values.
Thus, the domain for the situation is
b.
To Describe: The reason of graph being stopped.
Since the car cannot hold more than
Given information:
The graph relates the amount of gas in the tank of the car to the distance the car can drive.
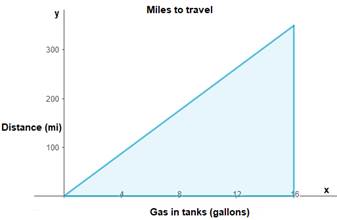
Explanation:
The reason of graph being stopped:
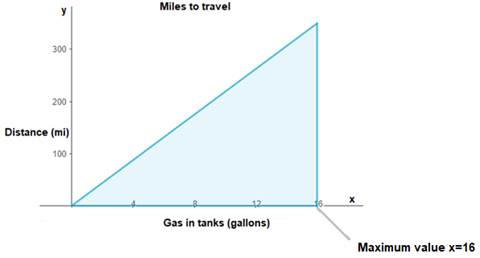
From the given graph, it's shown that the maximum gas in tanks is
completion of
c.
To Describe: The reason for showing only the first quadrant.
Only the first quadrant has positive files. Because, negative numbers are not possible in the given situation.
Given information:
The graph relates the amount of gas in the tank of the car to the distance the car can drive.
Explanation:
The reason for showing only the first quadrant:
In the graph, one cannot physically drive a negative number of miles nor have a negative amount of gas therefore it stops at
Only the first quadrant has positive values. So, only the first quadrant shown.
d.
To Explain: Whether every point in the solution region be a solution.
Yes, every point in the solution region be a solution.
Given information:
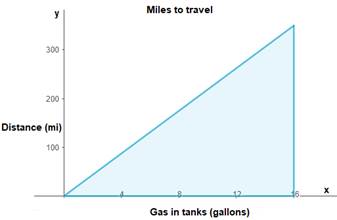
The graph relates the amount of gas in the tank of the car to the distance the car can drive.
Explanation:
Graphs are pictures of answers, and shaded areas on a graph show the answers that
support the inequality. So, every point in the solution region be a solution.
e.
To Write: The inequality for the given graph.
The inequality for the given graph is
Given information:
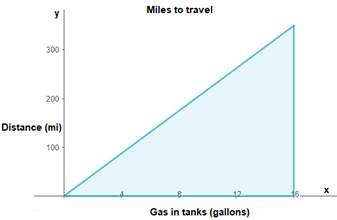
The graph relates the amount of gas in the tank of the car to the distance the car can drive.
Explanation:
Write the inequality:
The slope of the line can be found by selecting two points
Substitute
of gas in the tank are directly related), where
Since, the slope formula is
Since the region below the boundary line is shaded, the inequality for the given graph is:
f.
To Find: The coefficient of
The coefficient of
Given information:
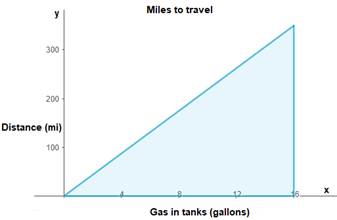
The graph relates the amount of gas in the tank of the car to the distance the car can drive.
Explanation:
In this equation, the coefficient
Since, from part
So, the co-efficient of
Chapter 2 Solutions
High School Math 2015 Common Core Algebra 2 Student Edition Grades 10/11
- e Grade Breakdown x Dashboard | Big Spring HX Dashboard | Big Spring H x Home | Lesson | Assessm cds.caolacourses.edisonlearning.com/lessons/assessmentplayer Co bigspringsd.org bookmarks Prodigy New Tab my video Brielynn... Algebra 2 Part 1-Exam-EDCP.MA003.A D Question 6 D ? 10 17°F Mostly sunny BSMS Home Significant Events in... Classes 25 26 27 28 29 30 31 32 33 34 35 36 37 38 39 40 Solve using row operations: x-3y= -4; 2x - y = 7 Use the paperclip button below to attach files. Student can enter max 2000 characters BISU DAIAAA X2 X2 T ② Type here Q Search e I ✓ Paragra Oarrow_forward1+3+5+7+ …+300 using gauss’s problemarrow_forwardFactor the expression. 5x³ (x²+8x)² - 35x (x²+8x) 2arrow_forward
 Algebra and Trigonometry (6th Edition)AlgebraISBN:9780134463216Author:Robert F. BlitzerPublisher:PEARSON
 Contemporary Abstract AlgebraAlgebraISBN:9781305657960Author:Joseph GallianPublisher:Cengage Learning
 Linear Algebra: A Modern IntroductionAlgebraISBN:9781285463247Author:David PoolePublisher:Cengage Learning
 Algebra And Trigonometry (11th Edition)AlgebraISBN:9780135163078Author:Michael SullivanPublisher:PEARSON
 Introduction to Linear Algebra, Fifth EditionAlgebraISBN:9780980232776Author:Gilbert StrangPublisher:Wellesley-Cambridge Press
 College Algebra (Collegiate Math)AlgebraISBN:9780077836344Author:Julie Miller, Donna GerkenPublisher:McGraw-Hill Education


