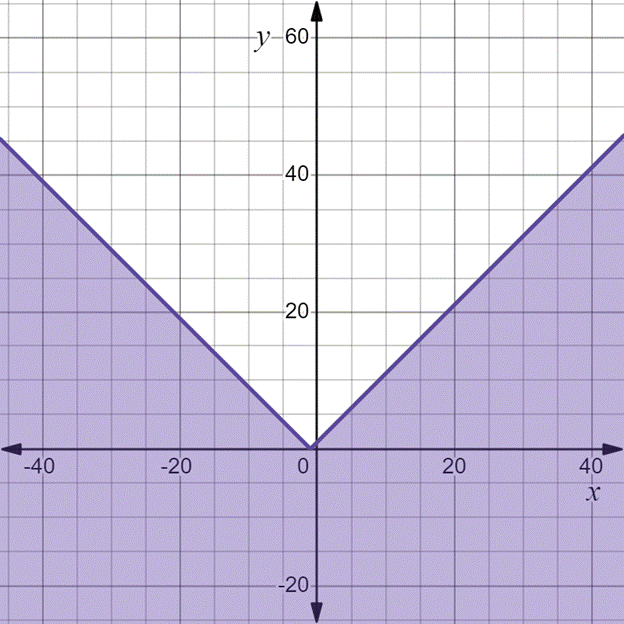
To draw: The inequality
Given information:
The given inequality is
Concept used:
A linear inequality is an inequality in two variables whose graph is a region of the coordinate plane bounded by a line. This is the boundary of the graph. The boundary separates the coordinate plane into two half planes, one of which consists of solutions of the inequality.
Plot the graph:
The graph of
Here the graph of the function is translated left
Since the graph is solved for
Now plot the graph of the given inequality.
Graph the boundary line
The graph is given below.

Chapter 2 Solutions
High School Math 2015 Common Core Algebra 2 Student Edition Grades 10/11
- e Grade Breakdown x Dashboard | Big Spring HX Dashboard | Big Spring H x Home | Lesson | Assessm cds.caolacourses.edisonlearning.com/lessons/assessmentplayer Co bigspringsd.org bookmarks Prodigy New Tab my video Brielynn... Algebra 2 Part 1-Exam-EDCP.MA003.A D Question 6 D ? 10 17°F Mostly sunny BSMS Home Significant Events in... Classes 25 26 27 28 29 30 31 32 33 34 35 36 37 38 39 40 Solve using row operations: x-3y= -4; 2x - y = 7 Use the paperclip button below to attach files. Student can enter max 2000 characters BISU DAIAAA X2 X2 T ② Type here Q Search e I ✓ Paragra Oarrow_forward1+3+5+7+ …+300 using gauss’s problemarrow_forwardFactor the expression. 5x³ (x²+8x)² - 35x (x²+8x) 2arrow_forward
 Algebra and Trigonometry (6th Edition)AlgebraISBN:9780134463216Author:Robert F. BlitzerPublisher:PEARSON
 Contemporary Abstract AlgebraAlgebraISBN:9781305657960Author:Joseph GallianPublisher:Cengage Learning
 Linear Algebra: A Modern IntroductionAlgebraISBN:9781285463247Author:David PoolePublisher:Cengage Learning
 Algebra And Trigonometry (11th Edition)AlgebraISBN:9780135163078Author:Michael SullivanPublisher:PEARSON
 Introduction to Linear Algebra, Fifth EditionAlgebraISBN:9780980232776Author:Gilbert StrangPublisher:Wellesley-Cambridge Press
 College Algebra (Collegiate Math)AlgebraISBN:9780077836344Author:Julie Miller, Donna GerkenPublisher:McGraw-Hill Education


