
a.
To Graph:
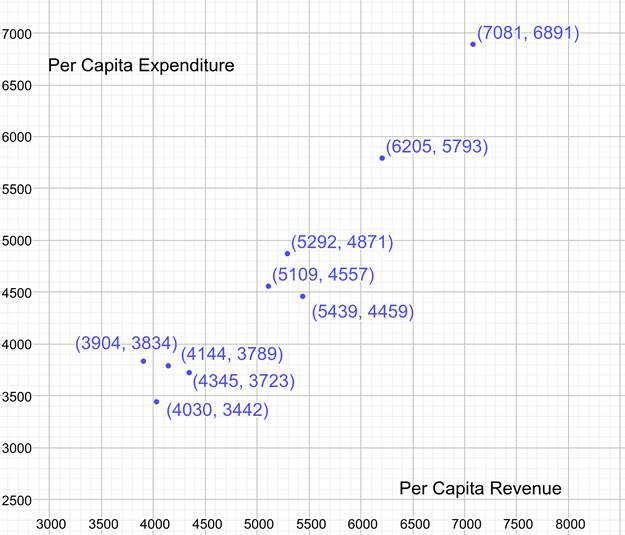
Show the given data in a
Given:
Per capita revenue and expenditure for a recent year.
| State | Per Capita Revenue | Per Capita Expenditure |
| Arizona | 4144 | 3789 |
| Georgia | 3904 | 3834 |
| Maryland | 5109 | 4557 |
| Mississippi | 5292 | 4871 |
| New Mexico | 6205 | 5793 |
| Nevada | 4345 | 3723 |
| New York | 7081 | 6891 |
| Texas | 4030 | 3442 |
| Utah | 5439 | 4459 |
Concepts Used:
Graphing given data points using a graphing calculator.
Determining the trend line for a given data set.
Calculations:
Draw the data points in the given table as a scatter plot using a graphing calculator.
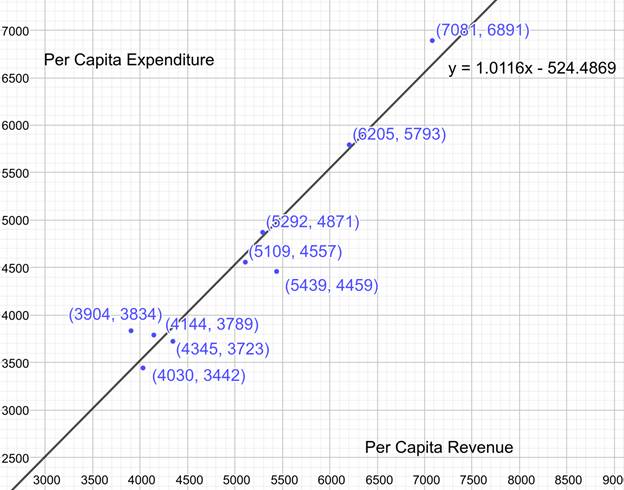
Fit the points to a trend line:
Conclusion:
The scatter plot graph of given points is made. The points have a trend line given by the equation
b.
To State:
The expected per capita expenditure for a state that collected revenue of
Given:
Per capita revenue and expenditure for a recent year.
| State | Per Capita Revenue | Per Capita Expenditure |
| Arizona | 4144 | 3789 |
| Georgia | 3904 | 3834 |
| Maryland | 5109 | 4557 |
| Mississippi | 5292 | 4871 |
| New Mexico | 6205 | 5793 |
| Nevada | 4345 | 3723 |
| New York | 7081 | 6891 |
| Texas | 4030 | 3442 |
| Utah | 5439 | 4459 |
Known from previous part:
The given data points have a trend line given by the equation
Concepts Used:
Estimating using a model.
Calculations:
The per capita revenue is given to be
Conclusion:
c.
To State:
The expected per capita taxes collectedfor the state Ohio that spent
Given:
Per capita revenue and expenditure for a recent year.
| State | Per Capita Revenue | Per Capita Expenditure |
| Arizona | 4144 | 3789 |
| Georgia | 3904 | 3834 |
| Maryland | 5109 | 4557 |
| Mississippi | 5292 | 4871 |
| New Mexico | 6205 | 5793 |
| Nevada | 4345 | 3723 |
| New York | 7081 | 6891 |
| Texas | 4030 | 3442 |
| Utah | 5439 | 4459 |
Known from previous part:
The given data points have a trend line given by the equation
Concepts Used:
Estimating using a model.
Calculations:
The per capita expenditure is given to be
Conclusion:
d.
To State:
Whether the given situation fits the linear trend line model for the given data table.
The model is satisfactorily accurate for the given situation.
Given:
Per capita revenue and expenditure for a recent year.
| State | Per Capita Revenue | Per Capita Expenditure |
| Arizona | 4144 | 3789 |
| Georgia | 3904 | 3834 |
| Maryland | 5109 | 4557 |
| Mississippi | 5292 | 4871 |
| New Mexico | 6205 | 5793 |
| Nevada | 4345 | 3723 |
| New York | 7081 | 6891 |
| Texas | 4030 | 3442 |
| Utah | 5439 | 4459 |
The situation:
New Jersey collected
Known from previous part:
The given data points have a trend line given by the equation
Concepts Used:
Verifying a model for a given point.
Calculations:
The per capita expenditure is given to be
Conclusion:
The equality
Thus the model is satisfactorily accurate for the given situation.
Chapter 2 Solutions
High School Math 2015 Common Core Algebra 2 Student Edition Grades 10/11

- Write an equation for the function shown. You may assume all intercepts and asymptotes are on integers. The blue dashed lines are the asymptotes. 10 9- 8- 7 6 5 4- 3- 2 4 5 15-14-13-12-11-10 -9 -8 -7 -6 -5 -4 -3 -2 1 1 2 3 -1 -2 -3 -4 1 -5 -6- -7 -8- -9 -10+ 60 7 8 9 10 11 12 13 14 15arrow_forwardUse the graph of the polynomial function of degree 5 to identify zeros and multiplicity. Order your zeros from least to greatest. -6 3 6+ 5 4 3 2 1 2 -1 -2 -3 -4 -5 3 4 6 Zero at with multiplicity Zero at with multiplicity Zero at with multiplicityarrow_forwardUse the graph to identify zeros and multiplicity. Order your zeros from least to greatest. 6 5 4 -6-5-4-3-2 3 21 2 1 2 4 5 ૪ 345 Zero at with multiplicity Zero at with multiplicity Zero at with multiplicity Zero at with multiplicity པ་arrow_forward
- Use the graph to write the formula for a polynomial function of least degree. -5 + 4 3 ♡ 2 12 1 f(x) -1 -1 f(x) 2 3. + -3 12 -5+ + xarrow_forwardUse the graph to identify zeros and multiplicity. Order your zeros from least to greatest. 6 -6-5-4-3-2-1 -1 -2 3 -4 4 5 6 a Zero at with multiplicity Zero at with multiplicity Zero at with multiplicity Zero at with multiplicityarrow_forwardUse the graph to write the formula for a polynomial function of least degree. 5 4 3 -5 -x 1 f(x) -5 -4 -1 1 2 3 4 -1 -2 -3 -4 -5 f(x) =arrow_forward
- Write the equation for the graphed function. -8 ง -6-5 + 5 4 3 2 1 -3 -2 -1 -1 -2 4 5 6 6 -8- f(x) 7 8arrow_forwardWrite the equation for the graphed function. 8+ 7 -8 ง A -6-5 + 6 5 4 3 -2 -1 2 1 -1 3 2 3 + -2 -3 -4 -5 16 -7 -8+ f(x) = ST 0 7 8arrow_forwardThe following is the graph of the function f. 48- 44 40 36 32 28 24 20 16 12 8 4 -4 -3 -1 -4 -8 -12 -16 -20 -24 -28 -32 -36 -40 -44 -48+ Estimate the intervals where f is increasing or decreasing. Increasing: Decreasing: Estimate the point at which the graph of ƒ has a local maximum or a local minimum. Local maximum: Local minimum:arrow_forward
- For the following exercise, find the domain and range of the function below using interval notation. 10+ 9 8 7 6 5 4 3 2 1 10 -9 -8 -7 -6 -5 -4 -3 -2 -1 2 34 5 6 7 8 9 10 -1 -2 Domain: Range: -4 -5 -6 -7- 67% 9 -8 -9 -10-arrow_forward1. Given that h(t) = -5t + 3 t². A tangent line H to the function h(t) passes through the point (-7, B). a. Determine the value of ẞ. b. Derive an expression to represent the gradient of the tangent line H that is passing through the point (-7. B). c. Hence, derive the straight-line equation of the tangent line H 2. The function p(q) has factors of (q − 3) (2q + 5) (q) for the interval -3≤ q≤ 4. a. Derive an expression for the function p(q). b. Determine the stationary point(s) of the function p(q) c. Classify the stationary point(s) from part b. above. d. Identify the local maximum of the function p(q). e. Identify the global minimum for the function p(q). 3. Given that m(q) = -3e-24-169 +9 (-39-7)(-In (30-755 a. State all the possible rules that should be used to differentiate the function m(q). Next to the rule that has been stated, write the expression(s) of the function m(q) for which that rule will be applied. b. Determine the derivative of m(q)arrow_forwardSafari File Edit View History Bookmarks Window Help Ο Ω OV O mA 0 mW ర Fri Apr 4 1 222 tv A F9 F10 DII 4 F6 F7 F8 7 29 8 00 W E R T Y U S D பட 9 O G H J K E F11 + 11 F12 O P } [arrow_forward
 Algebra and Trigonometry (6th Edition)AlgebraISBN:9780134463216Author:Robert F. BlitzerPublisher:PEARSON
 Contemporary Abstract AlgebraAlgebraISBN:9781305657960Author:Joseph GallianPublisher:Cengage Learning
 Linear Algebra: A Modern IntroductionAlgebraISBN:9781285463247Author:David PoolePublisher:Cengage Learning
 Algebra And Trigonometry (11th Edition)AlgebraISBN:9780135163078Author:Michael SullivanPublisher:PEARSON
 Introduction to Linear Algebra, Fifth EditionAlgebraISBN:9780980232776Author:Gilbert StrangPublisher:Wellesley-Cambridge Press
 College Algebra (Collegiate Math)AlgebraISBN:9780077836344Author:Julie Miller, Donna GerkenPublisher:McGraw-Hill Education