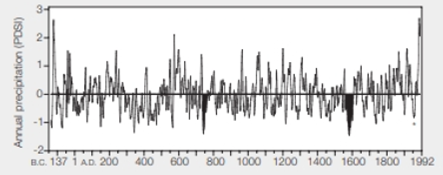
Tree Rings Reveal Droughts El Malpais National Monument, in west central New Mexico, has pockets of vegetation that have been surrounded by lava fields for about 3,000 years, so they have escaped wildfires, grazing animals, agricultural activity, and logging. Henri Grissino-Mayer generated a 2,129-year annual precipitation record using tree ring data from living and dead trees in this park (FIGURE 27.22).

FIGURE 27.22 Annual precipitation record for 2,129 years, inferred from compiled tree ring data in El Malpais National Monument, New Mexico. Data were averaged over 10-year intervals; the graph correlates with other indicators of rainfall collected in all parts of North America. PDSI, Palmer Drought Severity Index: 0, normal rainfall; increasing numbers mean increasing excess of rainfall; decreasing numbers mean increasing severity of drought.
* A severe drougt contributed to a series of catastrophic dust storms that turned the midwestern United States into a "dust bowl" between 1933 and 1939.
Around a.d.770, the Mayan civilization began to suffer a massive population loss, particularly in the southern lowlands of Mesoamerica. The El Malpais tree ring data show a drought during that time. Was it more or less severe than the Dust Bowl drought in 1933–1939?
To determine: Whether the drought at A.D. 770 was more or less severe than the Dust Bowl drought in 1933-1939.
Concept introduction: Tree rings are the number of concentric rings in the cross section of the tree trunks that represent a single year growth. Tree ring dating is done to find the exact year of their formation. Tree ring dating helps to analyze the atmospheric condition during the different periods in history. The researchers have created the record of drought dating back hundreds to thousands of years by using tree rings.
Explanation of Solution
The Mayan civilization suffers a massive population loss in the 770 AD. Between 1933 and 1939, a severe drought contributed to the series of the catastrophic dust storms that turned the Midwestern Unites States into a dust bowl. From the data, there is a point that extends to about -1.5 PDSI at 770 A.D. It indicates a severe drought. The dust bowl drought which is indicated by a * on the graph has a PDSI of about -1. Comparing to the drought at 770 A.D. it was more severe than the dust bowl.
The drought in the 770 A.D. was more severe than the drought during the dust bowl.
Want to see more full solutions like this?
Chapter 27 Solutions
Biology: The Unity and Diversity of Life (MindTap Course List)
Additional Science Textbook Solutions
Genetics: From Genes to Genomes
Campbell Essential Biology (7th Edition)
HUMAN ANATOMY
Chemistry: Atoms First
Cosmic Perspective Fundamentals
- What did the Cre-lox system used in the Kikuchi et al. 2010 heart regeneration experiment allow researchers to investigate? What was the purpose of the cmlc2 promoter? What is CreER and why was it used in this experiment? If constitutively active Cre was driven by the cmlc2 promoter, rather than an inducible CreER system, what color would you expect new cardiomyocytes in the regenerated area to be no matter what? Why?arrow_forwardWhat kind of organ size regulation is occurring when you graft multiple organs into a mouse and the graft weight stays the same?arrow_forwardWhat is the concept "calories consumed must equal calories burned" in regrads to nutrition?arrow_forward
- You intend to insert patched dominant negative DNA into the left half of the neural tube of a chick. 1) Which side of the neural tube would you put the positive electrode to ensure that the DNA ends up on the left side? 2) What would be the internal (within the embryo) control for this experiment? 3) How can you be sure that the electroporation method itself is not impacting the embryo? 4) What would you do to ensure that the electroporation is working? How can you tell?arrow_forwardDescribe a method to document the diffusion path and gradient of Sonic Hedgehog through the chicken embryo. If modifying the protein, what is one thing you have to consider in regards to maintaining the protein’s function?arrow_forwardThe following table is from Kumar et. al. Highly Selective Dopamine D3 Receptor (DR) Antagonists and Partial Agonists Based on Eticlopride and the D3R Crystal Structure: New Leads for Opioid Dependence Treatment. J. Med Chem 2016.arrow_forward
- The following figure is from Caterina et al. The capsaicin receptor: a heat activated ion channel in the pain pathway. Nature, 1997. Black boxes indicate capsaicin, white circles indicate resinferatoxin. You are a chef in a fancy new science-themed restaurant. You have a recipe that calls for 1 teaspoon of resinferatoxin, but you feel uncomfortable serving foods with "toxins" in them. How much capsaicin could you substitute instead?arrow_forwardWhat protein is necessary for packaging acetylcholine into synaptic vesicles?arrow_forward1. Match each vocabulary term to its best descriptor A. affinity B. efficacy C. inert D. mimic E. how drugs move through body F. how drugs bind Kd Bmax Agonist Antagonist Pharmacokinetics Pharmacodynamicsarrow_forward
 Biology: The Unity and Diversity of Life (MindTap...BiologyISBN:9781305073951Author:Cecie Starr, Ralph Taggart, Christine Evers, Lisa StarrPublisher:Cengage Learning
 Biology: The Unity and Diversity of Life (MindTap...BiologyISBN:9781337408332Author:Cecie Starr, Ralph Taggart, Christine Evers, Lisa StarrPublisher:Cengage Learning
 Biology (MindTap Course List)BiologyISBN:9781337392938Author:Eldra Solomon, Charles Martin, Diana W. Martin, Linda R. BergPublisher:Cengage Learning
 Biology: The Dynamic Science (MindTap Course List)BiologyISBN:9781305389892Author:Peter J. Russell, Paul E. Hertz, Beverly McMillanPublisher:Cengage Learning
 Human Biology (MindTap Course List)BiologyISBN:9781305112100Author:Cecie Starr, Beverly McMillanPublisher:Cengage Learning
 Biology 2eBiologyISBN:9781947172517Author:Matthew Douglas, Jung Choi, Mary Ann ClarkPublisher:OpenStax


