Concept explainers
Videos
(a)
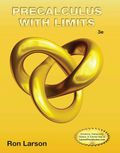
The graph using the graphical utility
(a)
Answer to Problem 72E
The graph gets increases monotonically.
Explanation of Solution
Given information:
The given equation as shown below,
Formula used:
The values are plotted against the positive x and y values.
Calculation:
Using a graphing utility, the graph of the model is as follows.
Conclusion:
The graph gets increases monotonically.
(b)
The populations when t=5; t=10; t=25
(b)
Answer to Problem 72E
The value of t=5 then N=333.33
The value of t=10 then N=500
The value of t=25 then N=800
Explanation of Solution
Given information:
The given equation as shown below,
Formula used:
The t values are replaced in
Calculation:
When t=5
When t=10
When t=25
Conclusion:
The N value gets increases as the temperature t increases
(c)
The limiting size of the herd as the time increases.
(c)
Answer to Problem 72E
The limiting size of the herd as time increases is 1,500
Explanation of Solution
Given information:
The given equation as shown below,
Formula used:
The t values are replaced in
Calculation:
As time increases, the limiting size of the herd is calculated as follows,
So the limiting size of the herd as time increases is 1,500
Conclusion:
The limiting size of the herd as time increases is 1,500
Chapter 2 Solutions
EBK PRECALCULUS W/LIMITS


- 8:38 *** TEMU TEMU -3 -2 7 B 2 1 & 5G. 61% 1 2 -1 Based on the graph above, determine the amplitude, period, midline, and equation of the function. Use f(x) as the output. Amplitude: 2 Period: 2 Midline: 2 ☑ syntax error: this is not an equation. Function: f(x) = −2 cos(πx + 2.5π) +2× Question Help: Worked Example 1 ☑ Message instructor Submit Question ||| <arrow_forward8:39 *** TEMU 5G 60% A ferris wheel is 28 meters in diameter and boarded from a platform that is 2 meters above the ground. The six o'clock position on the ferris wheel is level with the loading platform. The wheel completes 1 full revolution in 4 minutes. The function h = f(t) gives your height in meters above the ground t minutes after the wheel begins to turn. What is the amplitude? 14 meters What is the equation of the Midline? y = 16 What is the period? 4 meters minutes The equation that models the height of the ferris wheel after t minutes is: f(t): = ƒ (3) = ·−14(0) + 16 syntax error: you gave an equation, not an expression. syntax error. Check your variables - you might be using an incorrect one. How high are you off of the ground after 3 minutes? Round your answe the nearest meter. ||| <arrow_forwardcan you solve this question step by step pleasearrow_forward
- √3/2 1 √1-x2 arcsinx 1/2 dx = 2arrow_forwardThe evolution of a population of Hippos, R(t), in hundreds, time in years, in an African National Park is given by the equation, dR dt (a) Solve the system exactly for R(t). = R(7 – R); R(0) = 3 2 (b) What happens as the time t → ∞o, i.e. what is the population a long time in the future? (c) Write an Euler scheme and compute until the population levels off (using Excel, Matlab, Octave, LibreCalc or similar). Do it twice, once with At = 0.1 and once with At = 0.05. (d) Plot all of your solutions on the same set of axes and comment.arrow_forwardfind For triangle ABC, with vertices A = (3,-1,2), B = (-5,4,-4) and C = (6, −1, −1), (a) the length of side AB, (b) the equation of the line that passes through A and B, (c) the angle at vertex B, (d) a vector perpendicular to the plane containing the triangle ABC, (e) the area of the triangle ABC. (f) the equation of a plane passing through A, B and C.arrow_forward
 Calculus: Early TranscendentalsCalculusISBN:9781285741550Author:James StewartPublisher:Cengage Learning
 Thomas' Calculus (14th Edition)CalculusISBN:9780134438986Author:Joel R. Hass, Christopher E. Heil, Maurice D. WeirPublisher:PEARSON
 Calculus: Early Transcendentals (3rd Edition)CalculusISBN:9780134763644Author:William L. Briggs, Lyle Cochran, Bernard Gillett, Eric SchulzPublisher:PEARSON
 Calculus: Early TranscendentalsCalculusISBN:9781319050740Author:Jon Rogawski, Colin Adams, Robert FranzosaPublisher:W. H. Freeman
 Calculus: Early Transcendental FunctionsCalculusISBN:9781337552516Author:Ron Larson, Bruce H. EdwardsPublisher:Cengage Learning