Concept explainers
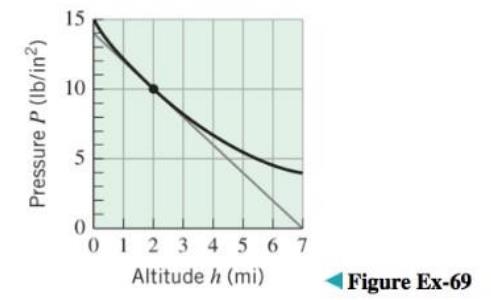
The accompanying figure shows the graph of atmospheric pressure
(a) From the graph and the tangent line at
(b) If the altitude of a space vehicle is increasing at the rate of

Want to see the full answer?
Check out a sample textbook solution
Chapter 2 Solutions
Calculus Early Transcendentals, Binder Ready Version
Additional Math Textbook Solutions
A Problem Solving Approach To Mathematics For Elementary School Teachers (13th Edition)
Elementary Statistics (13th Edition)
Elementary Statistics Using The Ti-83/84 Plus Calculator, Books A La Carte Edition (5th Edition)
Calculus for Business, Economics, Life Sciences, and Social Sciences (14th Edition)
Calculus: Early Transcendentals (2nd Edition)
- Hint: You may use the following derivative rules: ddxsin(x)=cos(x) ddxcos(x)=−sin(x) ddxln(x)=1x Find the equation of the tangent line to the curve y=4sinx at the point (π6,2).The equation of this tangent line isarrow_forwardQuestion Find the following limit. Select the correct answer below: 1 2 0 4 5x lim sin (2x)+tan 2 x→arrow_forward12. [0/1 Points] DETAILS MY NOTES SESSCALCET2 5.5.022. Evaluate the indefinite integral. (Use C for the constant of integration.) sin(In 33x) dxarrow_forward
- 2. [-/1 Points] DETAILS MY NOTES SESSCALCET2 5.5.003.MI. Evaluate the integral by making the given substitution. (Use C for the constant of integration.) x³ + 3 dx, u = x² + 3 Need Help? Read It Watch It Master It SUBMIT ANSWER 3. [-/1 Points] DETAILS MY NOTES SESSCALCET2 5.5.006.MI. Evaluate the integral by making the given substitution. (Use C for the constant of integration.) | +8 sec² (1/x³) dx, u = 1/x7 Need Help? Read It Master It SUBMIT ANSWER 4. [-/1 Points] DETAILS MY NOTES SESSCALCET2 5.5.007.MI. Evaluate the indefinite integral. (Use C for the constant of integration.) √x27 sin(x28) dxarrow_forward53,85÷1,5=arrow_forward3. In the space below, describe in what ways the function f(x) = -2√x - 3 has been transformed from the basic function √x. The graph f(x) on the coordinate plane at right. (4 points) -4 -&- -3 -- -2 4 3- 2 1- 1 0 1 2 -N -1- -2- -3- -4- 3 ++ 4arrow_forward
- 2. Suppose the graph below left is the function f(x). In the space below, describe what transformations are occuring in the transformed function 3ƒ(-2x) + 1. The graph it on the coordinate plane below right. (4 points)arrow_forward1 1. Suppose we have the function f(x) = = and then we transform it by moving it four units to the right and six units down, reflecting it horizontally, and stretching vertically by 5 units. What will the formula of our new function g(x) be? (2 points) g(x) =arrow_forwardSuppose an oil spill covers a circular area and the radius, r, increases according to the graph shown below where t represents the number of minutes since the spill was first observed. Radius (feet) 80 70 60 50 40 30 20 10 0 r 0 10 20 30 40 50 60 70 80 90 Time (minutes) (a) How large is the circular area of the spill 30 minutes after it was first observed? Give your answer in terms of π. square feet (b) If the cost to clean the oil spill is proportional to the square of the diameter of the spill, express the cost, C, as a function of the radius of the spill, r. Use a lower case k as the proportionality constant. C(r) = (c) Which of the following expressions could be used to represent the amount of time it took for the radius of the spill to increase from 20 feet to 60 feet? r(60) - r(20) Or¹(80-30) r(80) - r(30) r-1(80) - r−1(30) r-1(60) - r¹(20)arrow_forward

 Trigonometry (MindTap Course List)TrigonometryISBN:9781337278461Author:Ron LarsonPublisher:Cengage Learning
 Trigonometry (MindTap Course List)TrigonometryISBN:9781305652224Author:Charles P. McKeague, Mark D. TurnerPublisher:Cengage Learning
 Algebra: Structure And Method, Book 1AlgebraISBN:9780395977224Author:Richard G. Brown, Mary P. Dolciani, Robert H. Sorgenfrey, William L. ColePublisher:McDougal Littell
 Holt Mcdougal Larson Pre-algebra: Student Edition...AlgebraISBN:9780547587776Author:HOLT MCDOUGALPublisher:HOLT MCDOUGAL


